Allied Health Services at Community College of Allegheny County
If you plan to study Allied Health Services, take a look at what Community College of Allegheny County. We’ve gathered the following information to help you decide.
Community College of Allegheny County sits in Pittsburgh, PA.
For the most recent IPEDS reporting year, 48 allied health services degrees were awarded at Community College of Allegheny County.
Featured schools near , edit
Online & Distance Learning at Community College of Allegheny County
Distance learning is available at Community College of Allegheny County. Among 10,609 students, 1,913 (18%) were enrolled entirely in distance education and 2,629 (25%) took at least some classes online.
Allied Health Services Rankings at Community College of Allegheny County
Rankings can help you compare Community College of Allegheny County’s Allied Health Services program against peer institutions.
Associate-Level Rankings
| Ranking | Scope | Rank |
|---|---|---|
| Best Value | Pennsylvania | #2 of 29 |
| Best Schools (Quality) | Pennsylvania | #11 of 31 |
| Best Value | Middle Atlantic (Region) | #22 of 116 |
| Best Schools (Quality) | Middle Atlantic (Region) | #39 of 120 |
| Best Value | Nationwide | #296 of 1,049 |
| Best Schools (Quality) | Nationwide | #338 of 1,009 |
Earnings for Allied Health Services Graduates from Community College of Allegheny County
Graduates of Community College of Allegheny County’s Allied Health Services program report the following median earnings (per the U.S. Department of Education’s College Scorecard):

| Years After Graduation | Median Earnings |
|---|---|
| 1 year | $33,682 |
| 2 years | $35,772 |
| 3 years | $36,596 |
| 4 years | $38,809 |
| 5 years | $43,754 |
How do these earnings stack up against the rest of the school? Four years after graduating, Allied Health Services graduates from Community College of Allegheny County report median earnings of $38,809, compared with $43,778 for all Community College of Allegheny County graduates — about 11% lower than the school-wide median.

Median Debt at Graduation
Median student loan debt for Allied Health Services graduates from Community College of Allegheny County comes in at $19,922.
Student Demographics & Diversity
Below you’ll find the student demographics for Allied Health Services graduates at Community College of Allegheny County, broken down by degree level.
Across all degree levels, Allied Health Services graduates at Community College of Allegheny County are 81% women (39) and 19% men (9).
Allied Health Services Associate’s Program at Community College of Allegheny County
Among the 42 associate’s allied health services degrees awarded at Community College of Allegheny County, 81% were women (34) and 19% were men (8).

The following table and chart show the race/ethnicity of Allied Health Services associate’s degree recipients at Community College of Allegheny County.
| Race / Ethnicity | Number of Graduates |
|---|---|
| White | 32 |
| Hispanic / Latino | 1 |
| Black / African American | 3 |
| Asian | 2 |
| Two or More Races | 2 |
| Unknown | 2 |
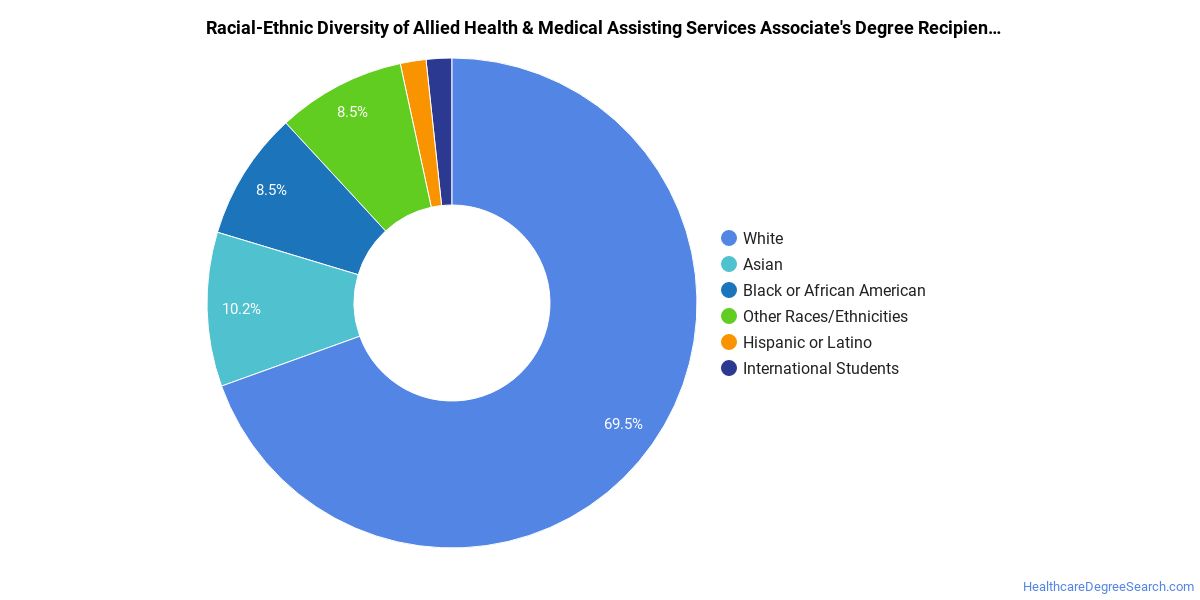
Minority students account for 19% of Allied Health Services associate’s degree recipients at Community College of Allegheny County, below the national average of 49%.*
*The racial-ethnic minorities figure is the total number of graduates minus White, international (nonresident), and unknown-race graduates.
More Specific Allied Health Services Concentrations at Community College of Allegheny County
This Allied Health Services program at Community College of Allegheny County offers more specialized concentrations:
| Concentration | Graduates |
|---|---|
| Medical/Clinical Assistant | 9 |
| Occupational Therapist Assistant | 19 |
| Physical Therapy Technician | 11 |
| Anesthesiologist Assistant | 9 |
Highest-Paying Careers for Allied Health Services Graduates
Students who finish Allied Health Services program at Community College of Allegheny County pursue many career paths. The table below ranks the best-paid careers for Allied Health Services graduates, ordered by median annual salary:
| Occupation | Nationwide Median Wage |
|---|---|
| Medical and Clinical Laboratory Technicians | $155,908 |
| Health Technologists and Technicians, All Other | $153,940 |
| Ophthalmic Medical Technologists | $153,819 |
| Neurodiagnostic Technologists | $81,316 |
| Histology Technicians | $80,721 |
| Surgical Technologists | $73,045 |
| Pharmacy Technicians | $72,773 |
| Ambulance Drivers and Attendants, Except Emergency Medical Technicians | $64,291 |
| Healthcare Support Workers, All Other | $53,362 |
| Speech-Language Pathology Assistants | $48,496 |
References
- IPEDS — Integrated Postsecondary Education Data System
- U.S. Department of Education — College Scorecard
- O*NET Online (Bureau of Labor Statistics)
- National Center for Education Statistics
More about our data sources and methodologies.
HealthcareDegreeSearch.com provides higher-education, college and university, degree, program, career, salary, and other helpful information to students, faculty, institutions, and other internet audiences. Presented information and data are subject to change. Inclusion on this website does not imply or represent a direct relationship with the company, school, or brand. Information, though believed correct at time of publication, may not be correct, and no warranty is provided. Contact the schools to verify any information before relying on it. Financial aid may be available for those who qualify. The displayed options may include sponsored or recommended results, not necessarily based on your preferences.
© HealthcareDegreeSearch.com – All Rights Reserved.