Allied Health Services at Cuyahoga Community College District
What traits are you looking for in a school for Allied Health Services, consider the program at Cuyahoga Community College District. The following information will help you decide if it is a good fit for you.
Cuyahoga Community College District is located in Cleveland, OH.
For the most recent IPEDS reporting year, 76 allied health services degrees were awarded at Cuyahoga Community College District.
Featured schools near , edit
Online Class Availability at Cuyahoga Community College District
Many students take online classes at Cuyahoga Community College District. Among 17,840 students, 5,808 (33%) were enrolled entirely in distance education and 5,345 (30%) took at least some classes online.
Allied Health Services Rankings at Cuyahoga Community College District
Use these rankings to compare Cuyahoga Community College District’s Allied Health Services program to other colleges that offer this major.
Associate-Level Rankings
| Ranking | Scope | Rank |
|---|---|---|
| Best Value | Ohio | #1 of 48 |
| Best Value | Great Lakes (Region) | #5 of 153 |
| Best Schools (Quality) | Ohio | #10 of 51 |
| Best Schools (Quality) | Great Lakes (Region) | #39 of 158 |
| Best Value | Nationwide | #43 of 1,049 |
| Best Schools (Quality) | Nationwide | #160 of 1,009 |
Earnings for Allied Health Services Graduates from Cuyahoga Community College District
Students who complete Cuyahoga Community College District’s Allied Health Services program report the following median earnings (per the U.S. Department of Education’s College Scorecard):

| Years After Graduation | Median Earnings |
|---|---|
| 1 year | $30,009 |
| 2 years | $34,628 |
| 3 years | $34,779 |
| 4 years | $38,005 |
| 5 years | $41,233 |
Is this above or below average for the school? At the four-year mark, Allied Health Services graduates from Cuyahoga Community College District report median earnings of $38,005, compared with $39,267 for all Cuyahoga Community College District graduates — about 3% lower than the school-wide median.

Median Debt at Graduation
The median debt for Allied Health Services graduates from Cuyahoga Community College District stands at $17,500.
Student Demographics & Diversity
Below you’ll find the student demographics for Allied Health Services graduates at Cuyahoga Community College District, by degree type.
Program-wide, Allied Health Services graduates at Cuyahoga Community College District are 92% women (70) and 8% men (6).
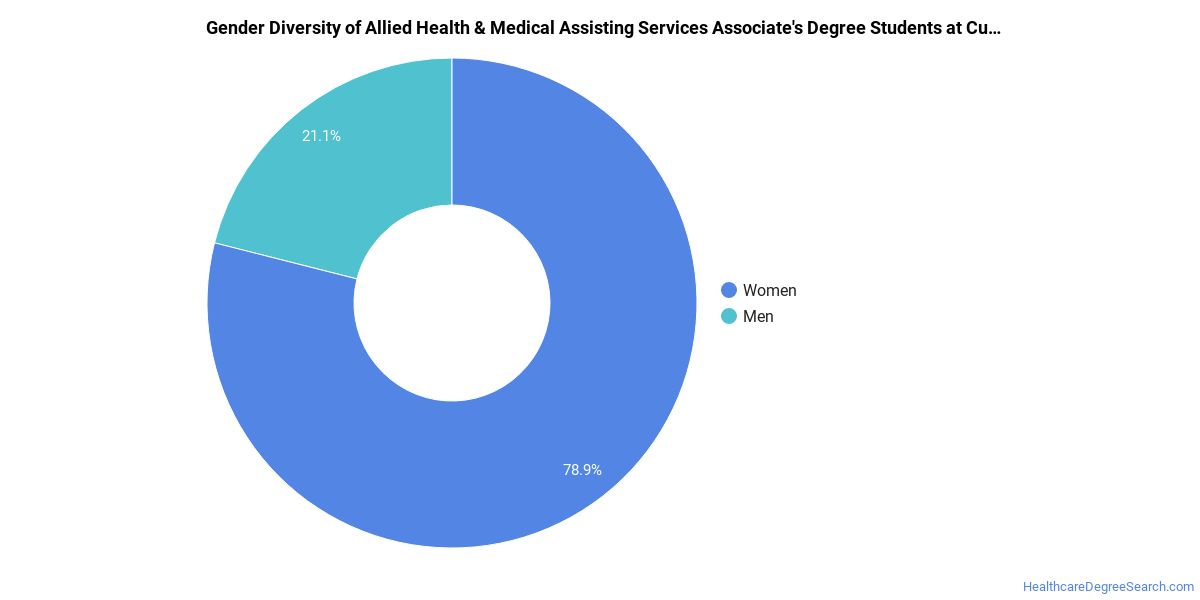
Allied Health Services Associate’s Program at Cuyahoga Community College District
Among the 52 associate’s allied health services graduates at Cuyahoga Community College District, 88% were women (46) and 12% were men (6).
The following table and chart show the race/ethnicity of Allied Health Services associate’s degree recipients at Cuyahoga Community College District.
| Race / Ethnicity | Number of Graduates |
|---|---|
| White | 31 |
| Hispanic / Latino | 5 |
| Black / African American | 10 |
| Asian | 2 |
| Two or More Races | 1 |
| International (Nonresident) | 2 |
| Unknown | 1 |
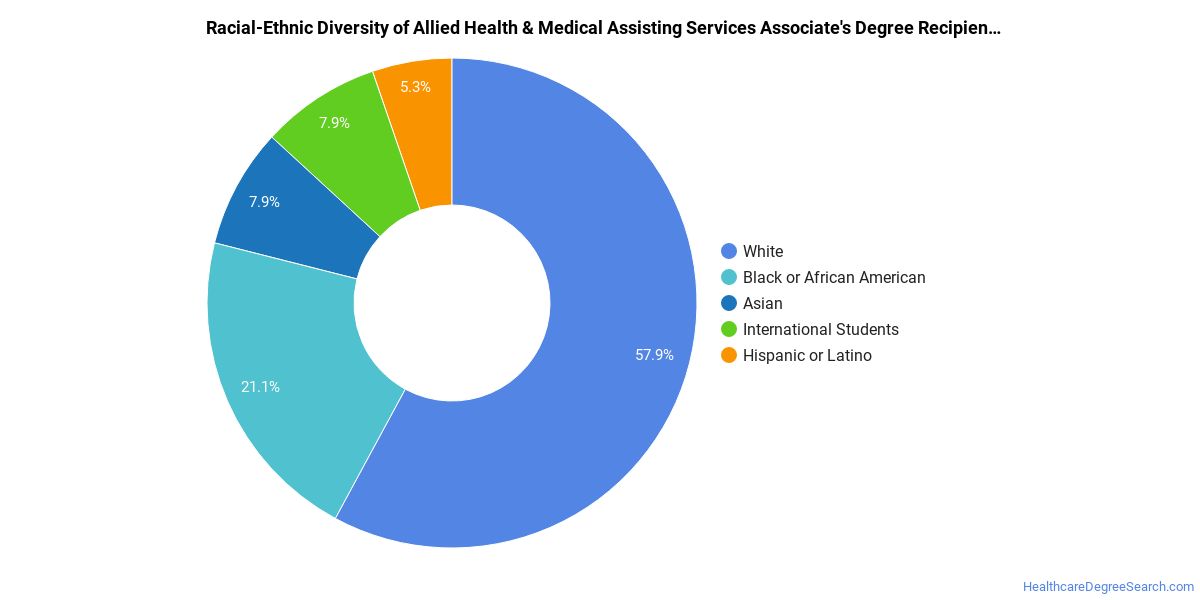
Minority students account for 35% of Allied Health Services associate’s degree recipients at Cuyahoga Community College District, lower than the national average of 49%.*
*The racial-ethnic minorities figure is the total number of graduates minus White, international (nonresident), and unknown-race graduates.
More Specific Allied Health Services Concentrations at Cuyahoga Community College District
This Allied Health Services program at Cuyahoga Community College District breaks down into more specific concentrations:
| Concentration | Graduates |
|---|---|
| Medical/Clinical Assistant | 23 |
| Medical Laboratory Assistant | 19 |
| Occupational Therapist Assistant | 15 |
| Pharmacy Technician/Assistant | 7 |
| Physical Therapy Technician | 12 |
Best-Paid Careers for Allied Health Services Graduates
Graduates of the Allied Health Services program at Cuyahoga Community College District pursue many career paths. Below are the top-paying careers for Allied Health Services graduates, ordered by median annual salary:
| Occupation | Nationwide Median Wage |
|---|---|
| Medical and Clinical Laboratory Technicians | $155,908 |
| Health Technologists and Technicians, All Other | $153,940 |
| Ophthalmic Medical Technologists | $153,819 |
| Neurodiagnostic Technologists | $81,316 |
| Histology Technicians | $80,721 |
| Surgical Technologists | $73,045 |
| Pharmacy Technicians | $72,773 |
| Ambulance Drivers and Attendants, Except Emergency Medical Technicians | $64,291 |
| Healthcare Support Workers, All Other | $53,362 |
| Speech-Language Pathology Assistants | $48,496 |
References
- IPEDS — Integrated Postsecondary Education Data System
- U.S. Department of Education — College Scorecard
- O*NET Online (Bureau of Labor Statistics)
- National Center for Education Statistics
More about our data sources and methodologies.
HealthcareDegreeSearch.com provides higher-education, college and university, degree, program, career, salary, and other helpful information to students, faculty, institutions, and other internet audiences. Presented information and data are subject to change. Inclusion on this website does not imply or represent a direct relationship with the company, school, or brand. Information, though believed correct at time of publication, may not be correct, and no warranty is provided. Contact the schools to verify any information before relying on it. Financial aid may be available for those who qualify. The displayed options may include sponsored or recommended results, not necessarily based on your preferences.
© HealthcareDegreeSearch.com – All Rights Reserved.