Music Therapy at Georgia College & State University
If you plan to study Music Therapy, consider the program at Georgia College & State University. Get started with the following essential facts.
Georgia College & State University is in Milledgeville, GA.
In the most recent year for which we have data, 16 music therapy degrees were granted at Georgia College & State University.
Featured schools near , edit
Studying Online at Georgia College & State University
Distance learning is available at Georgia College & State University. Among 7,097 students, 675 (10%) studied exclusively online and 694 (10%) took at least some classes online.
Music Therapy Rankings at Georgia College & State University
These rankings give you a sense of how Georgia College & State University’s Music Therapy program against other schools offering the same major.
Bachelor’s-Level Rankings
| Ranking | Scope | Rank |
|---|---|---|
| Best Schools (Quality) | Georgia | #1 of 1 |
| Best Value | Georgia | #1 of 1 |
| Best Schools (Quality) | Southeast (Region) | #4 of 5 |
| Best Value | Southeast (Region) | #6 of 9 |
| Best Schools (Quality) | Nationwide | #16 of 26 |
| Best Value | Nationwide | #19 of 47 |
Master’s-Level Rankings
| Ranking | Scope | Rank |
|---|---|---|
| Best Schools (Quality) | Georgia | #1 of 1 |
| Best Value | Georgia | #1 of 1 |
| Best Schools (Quality) | Southeast (Region) | #4 of 5 |
| Best Value | Southeast (Region) | #6 of 9 |
| Best Schools (Quality) | Nationwide | #16 of 26 |
| Best Value | Nationwide | #19 of 47 |
Student Demographics & Diversity
Take a look at the composition of Music Therapy graduates at Georgia College & State University, broken down by degree level.
Program-wide, Music Therapy graduates at Georgia College & State University are 100% women (16) and 0% men (0).
Music Therapy Bachelor’s Program at Georgia College & State University
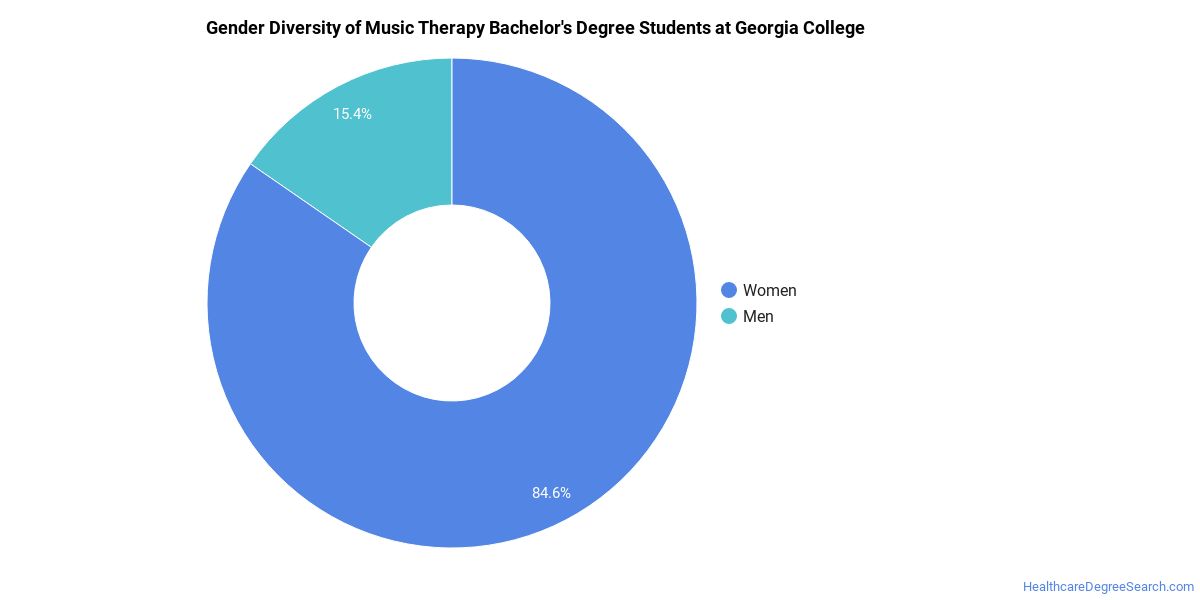
Among the 13 bachelor’s music therapy degrees awarded at Georgia College & State University, 100% were women (13) and 0% were men (0).
The following table and chart show the race/ethnicity of Music Therapy bachelor’s degree recipients at Georgia College & State University.
| Race / Ethnicity | Number of Graduates |
|---|---|
| White | 10 |
| Hispanic / Latino | 2 |
| Black / African American | 1 |
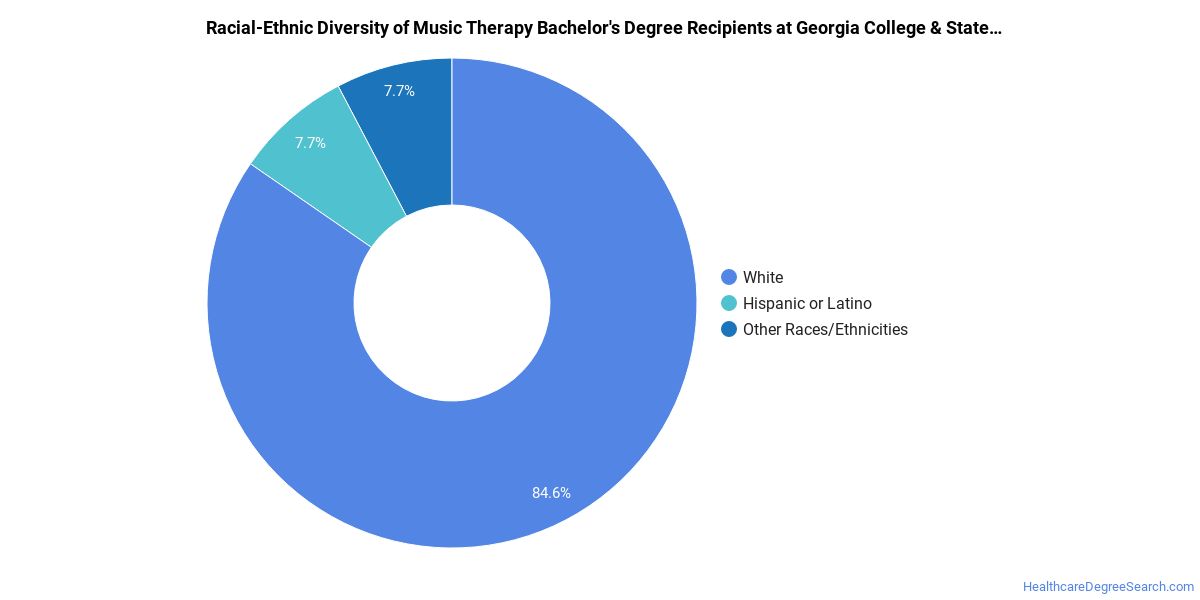
Racial-ethnic minorities make up 23% of Music Therapy bachelor’s degree recipients at Georgia College & State University, higher than the national average of 23%.*
Music Therapy Master’s Program at Georgia College & State University
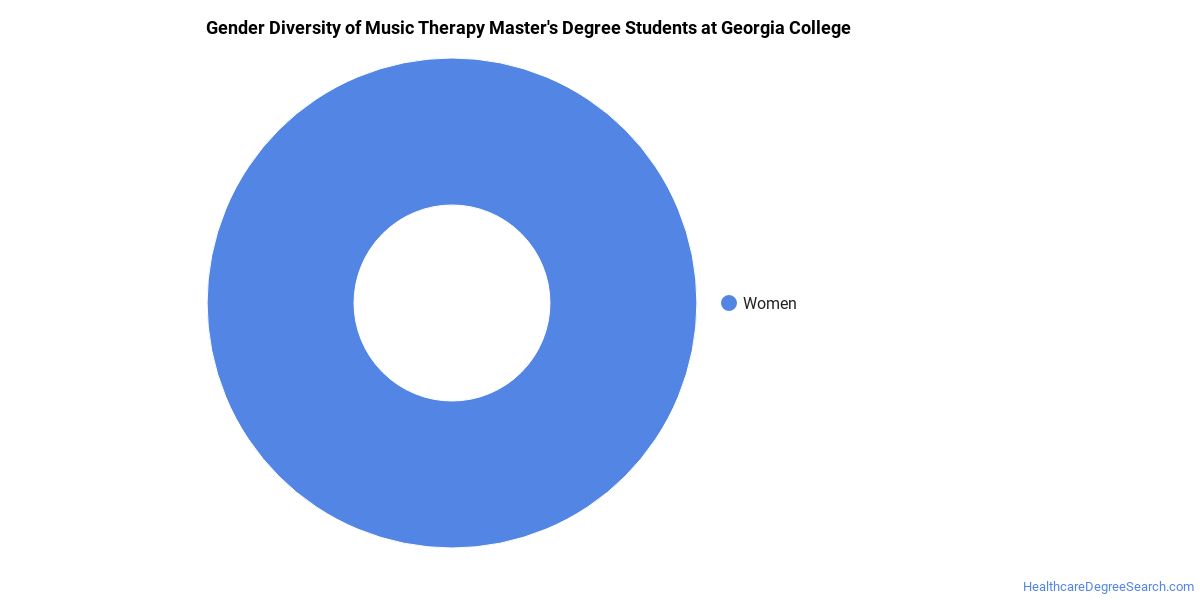
Among the 3 master’s music therapy graduates at Georgia College & State University, 100% were women (3) and 0% were men (0).
The following table and chart show the race/ethnicity of Music Therapy master’s degree recipients at Georgia College & State University.
| Race / Ethnicity | Number of Graduates |
|---|---|
| White | 2 |
| Black / African American | 1 |
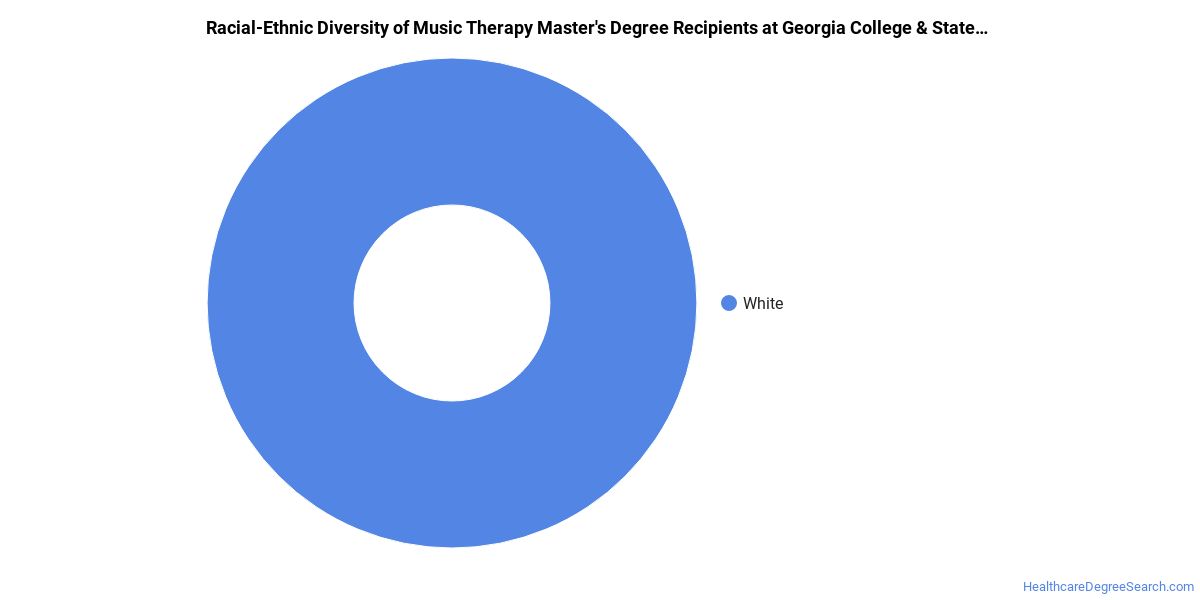
Minority students account for 33% of Music Therapy master’s degree recipients at Georgia College & State University, above the national average of 21%.*
*The racial-ethnic minorities figure is the total number of graduates minus White, international (nonresident), and unknown-race graduates.
Highest-Paying Careers for Music Therapy Graduates
Graduates of the Music Therapy program at Georgia College & State University go on to a range of careers. The table below ranks the top-paying careers for Music Therapy graduates, ordered by median annual salary:
| Occupation | Nationwide Median Wage |
|---|---|
| Therapists, All Other | $121,750 |
| Music Therapists | $71,670 |
| Health Specialties Teachers, Postsecondary | $46,663 |
| Art Therapists | $40,748 |
References
- IPEDS — Integrated Postsecondary Education Data System
- U.S. Department of Education — College Scorecard
- O*NET Online (Bureau of Labor Statistics)
- National Center for Education Statistics
More about our data sources and methodologies.
HealthcareDegreeSearch.com provides higher-education, college and university, degree, program, career, salary, and other helpful information to students, faculty, institutions, and other internet audiences. Presented information and data are subject to change. Inclusion on this website does not imply or represent a direct relationship with the company, school, or brand. Information, though believed correct at time of publication, may not be correct, and no warranty is provided. Contact the schools to verify any information before relying on it. Financial aid may be available for those who qualify. The displayed options may include sponsored or recommended results, not necessarily based on your preferences.
© HealthcareDegreeSearch.com – All Rights Reserved.