Public Health at Lindenwood University
If you are interested in studying Public Health, you may want to check out the program at Lindenwood University. We’ve gathered the following information to help you decide.
Lindenwood University is located in Saint Charles, MO.
For the most recent IPEDS reporting year, 19 public health degrees were awarded at Lindenwood University.
Featured schools near , edit
Online & Distance Learning at Lindenwood University
Distance learning is available at Lindenwood University. Of 6,826 students, 3,177 (47%) studied exclusively online and 2,994 (44%) took at least some classes online.
Public Health Rankings at Lindenwood University
Use these rankings to compare Lindenwood University’s Public Health program against other schools offering the same major.
Bachelor’s-Level Rankings
| Ranking | Scope | Rank |
|---|---|---|
| Best Schools (Quality) | Missouri | #5 of 9 |
| Best Value | Missouri | #6 of 9 |
| Best Schools (Quality) | The Plains States (Region) | #12 of 34 |
| Best Value | The Plains States (Region) | #16 of 32 |
| Best Schools (Quality) | Nationwide | #212 of 430 |
| Best Value | Nationwide | #237 of 411 |
Median Debt at Graduation
Median student loan debt for Public Health graduates from Lindenwood University comes in at $27,000.
Student Demographics & Diversity
Below you’ll find the composition of Public Health graduates at Lindenwood University, by degree type.
Across all degree levels, Public Health graduates at Lindenwood University are 84% women (16) and 16% men (3).
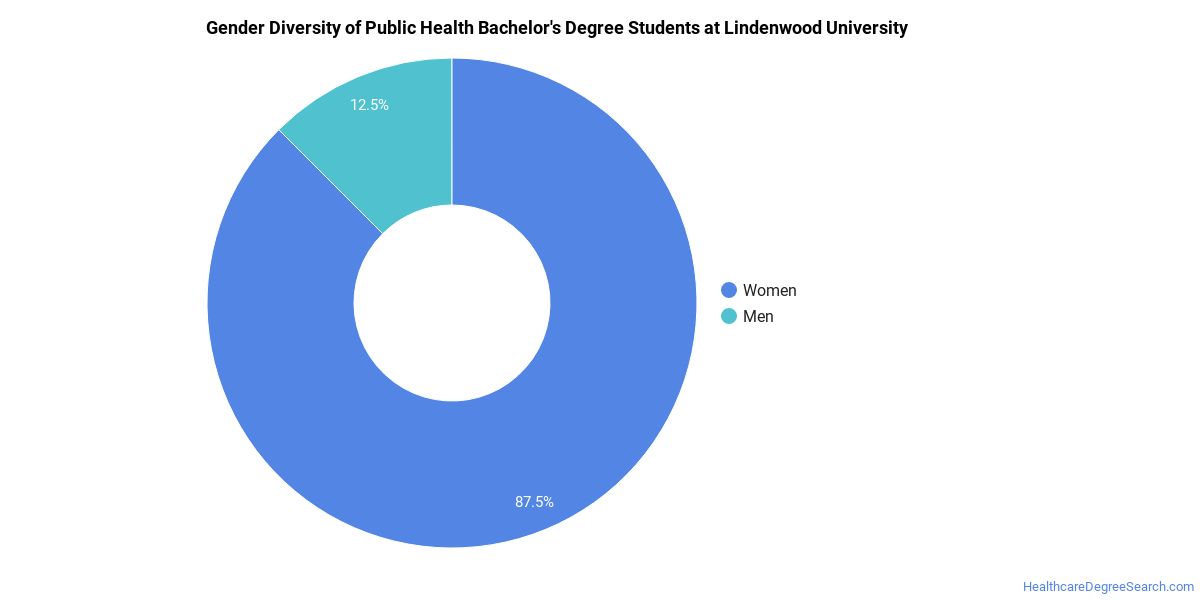
Public Health Bachelor’s Program at Lindenwood University
Of the 19 bachelor’s public health degrees awarded at Lindenwood University, 84% were women (16) and 16% were men (3).
The following table and chart show the race/ethnicity of Public Health bachelor’s degree recipients at Lindenwood University.
| Race / Ethnicity | Number of Graduates |
|---|---|
| White | 9 |
| Hispanic / Latino | 2 |
| Black / African American | 3 |
| Asian | 2 |
| Native Hawaiian / Pacific Islander | 1 |
| Two or More Races | 1 |
| Unknown | 1 |
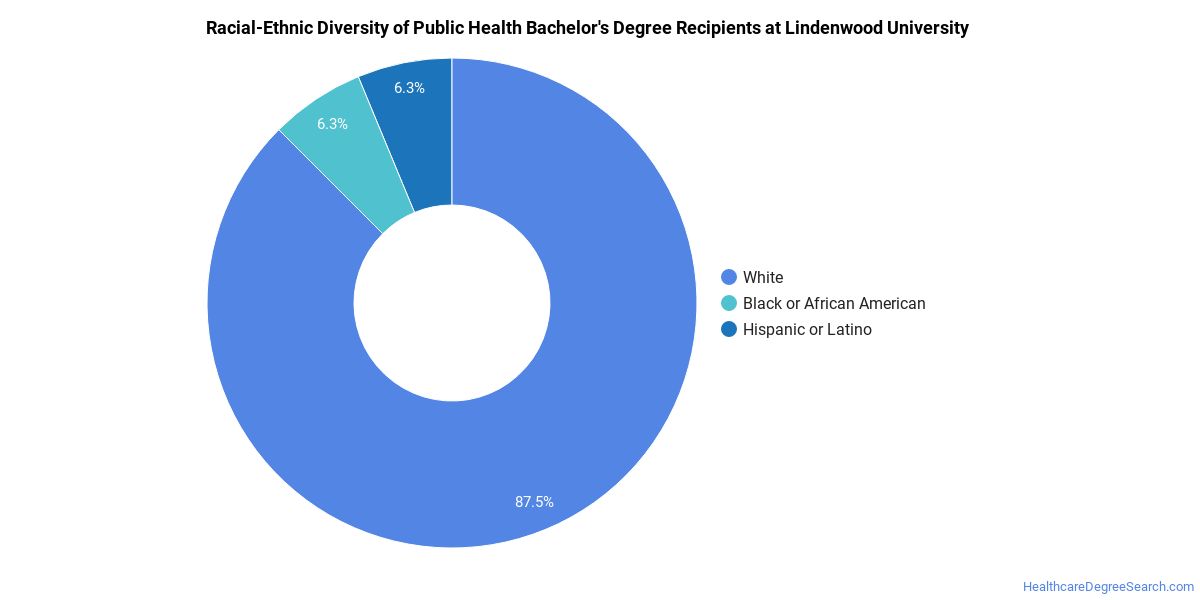
Minority students account for 47% of Public Health bachelor’s degree recipients at Lindenwood University, below the national average of 57%.*
*The racial-ethnic minorities figure is the total number of graduates minus White, international (nonresident), and unknown-race graduates.
More Specific Public Health Concentrations at Lindenwood University
This Public Health program at Lindenwood University includes the following sub-specializations:
| Concentration | Graduates |
|---|---|
| General Public Health | 19 |
Top-Paying Careers for Public Health Graduates
Graduates of the Public Health program at Lindenwood University go on to a range of careers. The table below ranks the best-paid careers for Public Health majors, ordered by median annual salary:
| Occupation | Nationwide Median Wage |
|---|---|
| Medical and Health Services Managers | $129,557 |
| Physicists | $111,776 |
| Medical Scientists, Except Epidemiologists | $111,314 |
| Environmental Scientists and Specialists, Including Health | $90,139 |
| Epidemiologists | $87,636 |
| Industrial Ecologists | $83,212 |
| Health Education Specialists | $81,726 |
| Community Health Workers | $73,901 |
| Environmental Restoration Planners | $61,737 |
| Genetic Counselors | $58,726 |
References
- IPEDS — Integrated Postsecondary Education Data System
- U.S. Department of Education — College Scorecard
- O*NET Online (Bureau of Labor Statistics)
- National Center for Education Statistics
More about our data sources and methodologies.
HealthcareDegreeSearch.com provides higher-education, college and university, degree, program, career, salary, and other helpful information to students, faculty, institutions, and other internet audiences. Presented information and data are subject to change. Inclusion on this website does not imply or represent a direct relationship with the company, school, or brand. Information, though believed correct at time of publication, may not be correct, and no warranty is provided. Contact the schools to verify any information before relying on it. Financial aid may be available for those who qualify. The displayed options may include sponsored or recommended results, not necessarily based on your preferences.
© HealthcareDegreeSearch.com – All Rights Reserved.