Mental & Social Health Services at Northcentral Technical College
What traits are you looking for in a school for Mental & Social Health Services, take a look at what Northcentral Technical College. Get started with the following essential facts.
Northcentral Technical College is in Wausau, WI.
For the most recent IPEDS reporting year, 73 mental & social health services degrees were granted at Northcentral Technical College.
Featured schools near , edit
Studying Online at Northcentral Technical College
Online coursework is an option at Northcentral Technical College. Of 6,746 students, 1,642 (24%) were enrolled entirely in distance education and 896 (13%) took at least some classes online.
Mental & Social Health Services Rankings at Northcentral Technical College
These rankings give you a sense of how Northcentral Technical College’s Mental & Social Health Services program against other schools offering the same major.
Associate-Level Rankings
| Ranking | Scope | Rank |
|---|---|---|
| Best Value | Wisconsin | #8 of 17 |
| Best Schools (Quality) | Wisconsin | #14 of 17 |
| Best Value | Great Lakes (Region) | #29 of 80 |
| Best Schools (Quality) | Great Lakes (Region) | #53 of 81 |
| Best Value | Nationwide | #197 of 514 |
| Best Schools (Quality) | Nationwide | #359 of 530 |
Earnings for Mental & Social Health Services Graduates from Northcentral Technical College
Those who finish Northcentral Technical College’s Mental & Social Health Services program earn the following amounts (per the U.S. Department of Education’s College Scorecard):

| Years After Graduation | Median Earnings |
|---|---|
| 1 year | $28,352 |
| 2 years | $29,685 |
| 3 years | $25,268 |
| 4 years | $25,824 |
| 5 years | $37,012 |
Is this above or below average for the school? Four years after graduating, Mental & Social Health Services graduates from Northcentral Technical College take home a median $25,824, compared with $40,298 for all Northcentral Technical College graduates — about 36% lower than the school-wide median.

Median Debt at Graduation
Median student loan debt for Mental & Social Health Services graduates from Northcentral Technical College comes in at $16,882.
Student Demographics & Diversity
Below you’ll find the composition of Mental & Social Health Services graduates at Northcentral Technical College, broken down by degree level.
Across all degree levels, Mental & Social Health Services graduates at Northcentral Technical College are 93% women (68) and 7% men (5).
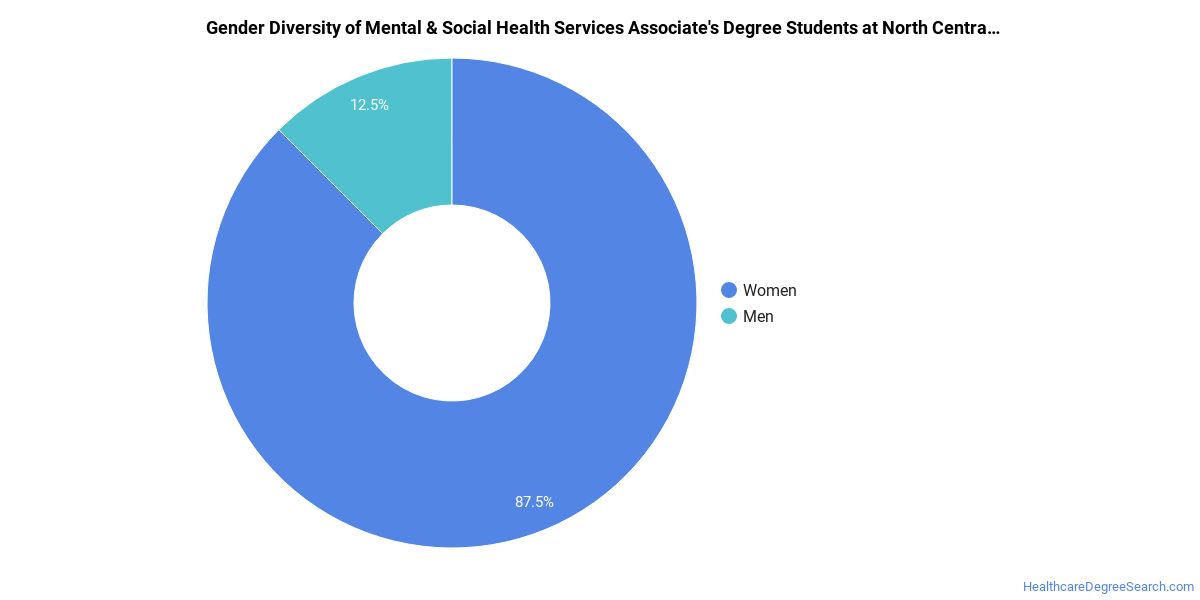
Mental & Social Health Services Associate’s Program at Northcentral Technical College
Among the 27 associate’s mental & social health services graduates at Northcentral Technical College, 93% were women (25) and 7% were men (2).
The following table and chart show the race/ethnicity of Mental & Social Health Services associate’s degree recipients at Northcentral Technical College.
| Race / Ethnicity | Number of Graduates |
|---|---|
| White | 25 |
| Hispanic / Latino | 1 |
| Unknown | 1 |
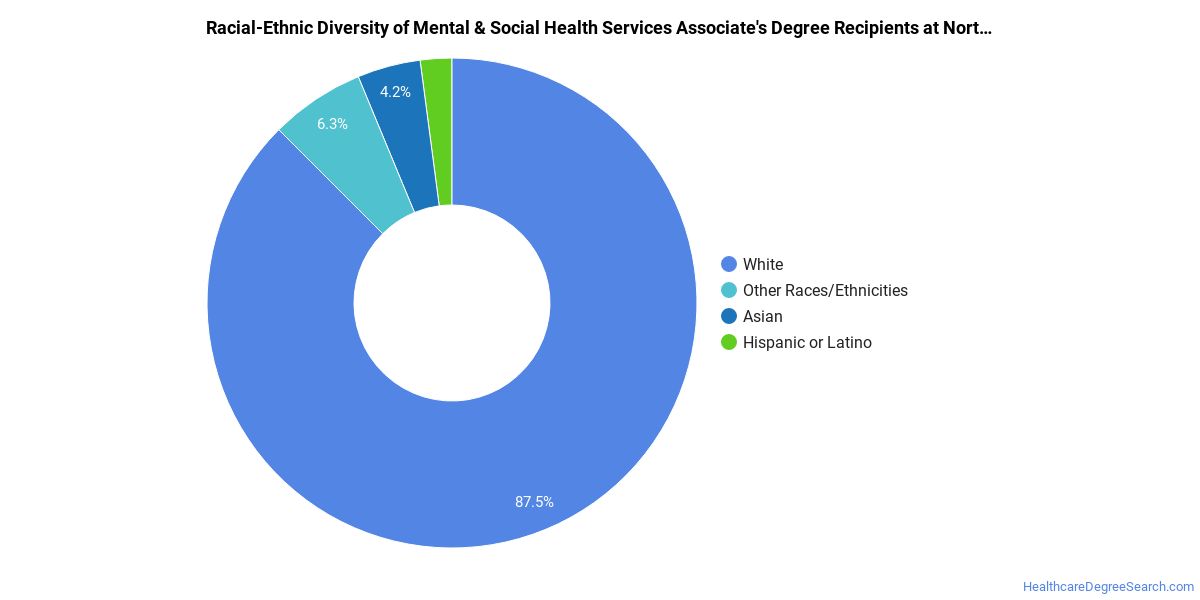
Minority students account for 4% of Mental & Social Health Services associate’s degree recipients at Northcentral Technical College, lower than the national average of 48%.*
*The racial-ethnic minorities figure is the total number of graduates minus White, international (nonresident), and unknown-race graduates.
More Specific Mental & Social Health Services Concentrations at Northcentral Technical College
This Mental & Social Health Services program at Northcentral Technical College includes the following sub-specializations:
| Concentration | Graduates |
|---|---|
| Substance Abuse/Addiction Counseling | 13 |
| Mental Health Services Technician | 60 |
Best-Paid Careers for Mental & Social Health Services Graduates
Those who complete Mental & Social Health Services program at Northcentral Technical College go on to a range of careers. The table below ranks the top-paying careers for Mental & Social Health Services graduates, ordered by median annual salary:
| Occupation | Nationwide Median Wage |
|---|---|
| Psychology Teachers, Postsecondary | $98,479 |
| Counselors, All Other | $81,766 |
| Health Education Specialists | $81,726 |
| Healthcare Social Workers | $78,044 |
| Marriage and Family Therapists | $74,325 |
| Community Health Workers | $73,901 |
| Mental Health Counselors | $72,983 |
| Social Work Teachers, Postsecondary | $65,510 |
| Genetic Counselors | $58,726 |
| Mental Health and Substance Abuse Social Workers | $58,560 |
References
- IPEDS — Integrated Postsecondary Education Data System
- U.S. Department of Education — College Scorecard
- O*NET Online (Bureau of Labor Statistics)
- National Center for Education Statistics
More about our data sources and methodologies.
HealthcareDegreeSearch.com provides higher-education, college and university, degree, program, career, salary, and other helpful information to students, faculty, institutions, and other internet audiences. Presented information and data are subject to change. Inclusion on this website does not imply or represent a direct relationship with the company, school, or brand. Information, though believed correct at time of publication, may not be correct, and no warranty is provided. Contact the schools to verify any information before relying on it. Financial aid may be available for those who qualify. The displayed options may include sponsored or recommended results, not necessarily based on your preferences.
© HealthcareDegreeSearch.com – All Rights Reserved.