Mental & Social Health Services at University of Holy Cross
If you plan to study Mental & Social Health Services, take a look at what University of Holy Cross. We’ve gathered the following information to help you decide.
University of Holy Cross is located in New Orleans, LA.
In the most recent year for which we have data, 35 mental & social health services degrees were awarded at University of Holy Cross.
Featured schools near , edit
Online Class Availability at University of Holy Cross
Distance learning is available at University of Holy Cross. Among 802 students, 425 (53%) studied exclusively online and 180 (22%) took at least some classes online.
Mental & Social Health Services Rankings at University of Holy Cross
Rankings can help you compare University of Holy Cross’s Mental & Social Health Services program against peer institutions.
Master’s-Level Rankings
| Ranking | Scope | Rank |
|---|---|---|
| Best Value | Louisiana | #3 of 5 |
| Best Schools (Quality) | Louisiana | #5 of 5 |
| Best Value | Southeast (Region) | #74 of 116 |
| Best Schools (Quality) | Southeast (Region) | #106 of 110 |
| Best Value | Nationwide | #310 of 514 |
| Best Schools (Quality) | Nationwide | #504 of 530 |
Earnings for Mental & Social Health Services Graduates from University of Holy Cross
Graduates of University of Holy Cross’s Mental & Social Health Services program earn the following amounts (per the U.S. Department of Education’s College Scorecard):

| Years After Graduation | Median Earnings |
|---|---|
| 1 year | $33,426 |
| 2 years | $41,007 |
| 3 years | $42,865 |
| 4 years | $43,546 |
| 5 years | $52,004 |
How do these earnings stack up against the rest of the school? At the four-year mark, Mental & Social Health Services graduates from University of Holy Cross take home a median $43,546, compared with $54,639 for all University of Holy Cross graduates — about 20% lower than the school-wide median.

Student Demographics & Diversity
Take a look at the diversity of Mental & Social Health Services graduates at University of Holy Cross, by degree type.
Looking at the program as a whole, Mental & Social Health Services graduates at University of Holy Cross are 86% women (30) and 14% men (5).
Mental & Social Health Services Bachelor’s Program at University of Holy Cross
Of the 1 bachelor’s mental & social health services graduates at University of Holy Cross, 100% were women (1) and 0% were men (0).

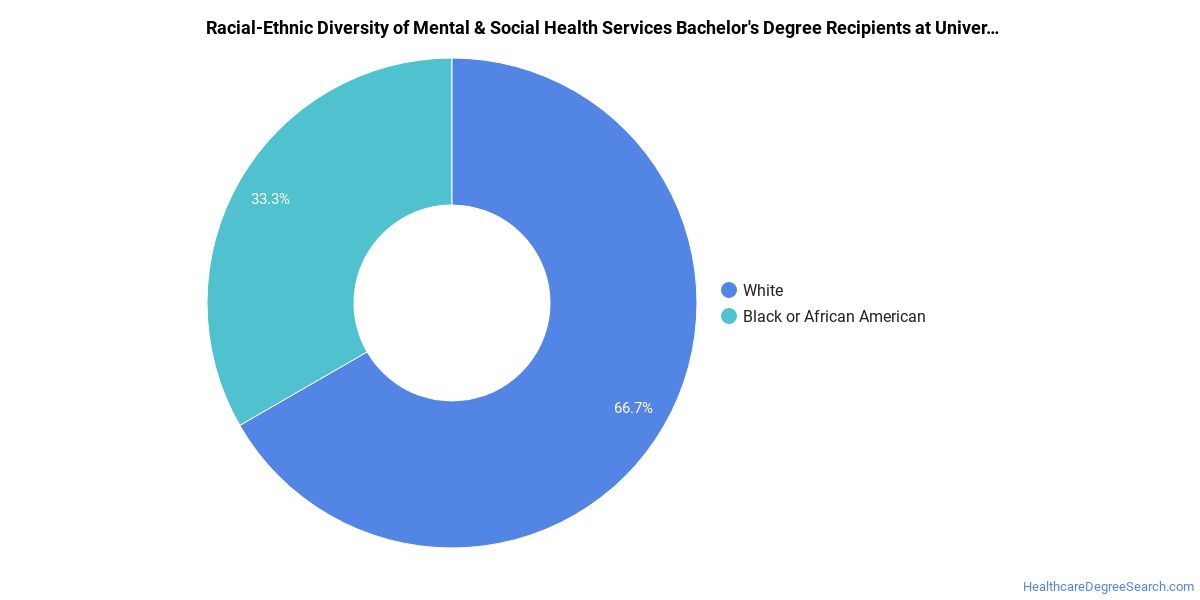
The following table and chart show the race/ethnicity of Mental & Social Health Services bachelor’s degree recipients at University of Holy Cross.
| Race / Ethnicity | Number of Graduates |
|---|---|
| White | 1 |
Mental & Social Health Services Master’s Program at University of Holy Cross
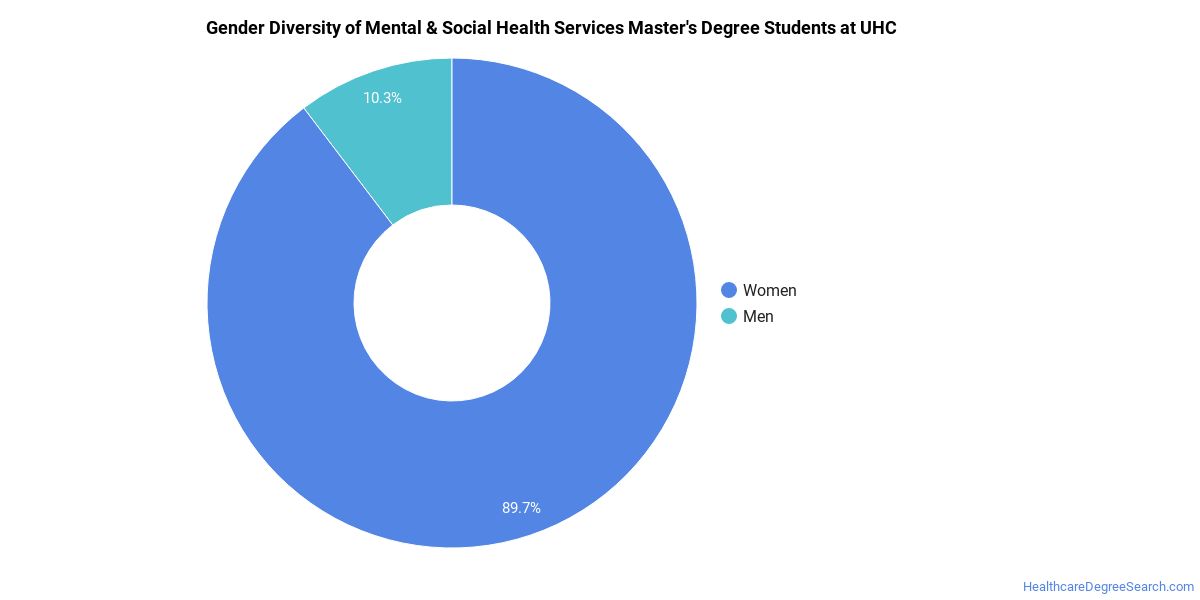
Among the 34 master’s mental & social health services degrees awarded at University of Holy Cross, 85% were women (29) and 15% were men (5).
The following table and chart show the race/ethnicity of Mental & Social Health Services master’s degree recipients at University of Holy Cross.
| Race / Ethnicity | Number of Graduates |
|---|---|
| White | 25 |
| Hispanic / Latino | 2 |
| Black / African American | 5 |
| Two or More Races | 1 |
| Unknown | 1 |
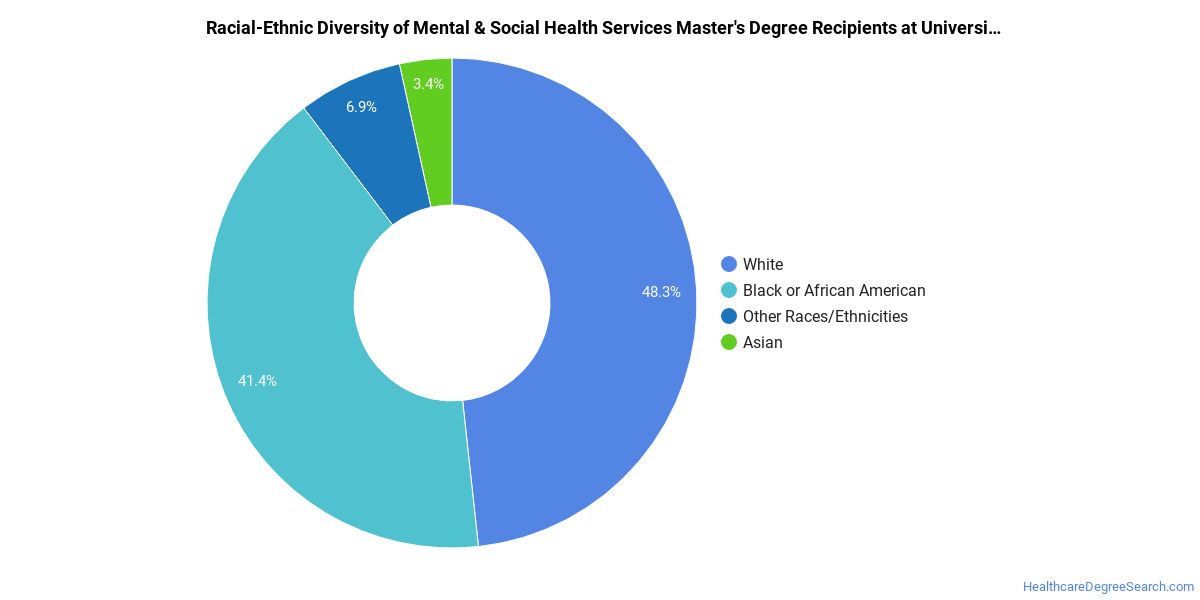
Minority students account for 24% of Mental & Social Health Services master’s degree recipients at University of Holy Cross, below the national average of 37%.*
*The racial-ethnic minorities figure is the total number of graduates minus White, international (nonresident), and unknown-race graduates.
More Specific Mental & Social Health Services Concentrations at University of Holy Cross
The Mental & Social Health Services program at University of Holy Cross includes the following sub-specializations:
| Concentration | Graduates |
|---|---|
| Community Health Services/Counseling | 1 |
| Marriage & Family Therapy/Counseling | 7 |
| Mental Health Counseling | 27 |
Best-Paid Careers for Mental & Social Health Services Graduates
Those who complete Mental & Social Health Services program at University of Holy Cross pursue many career paths. Here are the best-paid careers for Mental & Social Health Services graduates, ordered by median annual salary:
| Occupation | Nationwide Median Wage |
|---|---|
| Psychology Teachers, Postsecondary | $98,479 |
| Counselors, All Other | $81,766 |
| Health Education Specialists | $81,726 |
| Healthcare Social Workers | $78,044 |
| Marriage and Family Therapists | $74,325 |
| Community Health Workers | $73,901 |
| Mental Health Counselors | $72,983 |
| Social Work Teachers, Postsecondary | $65,510 |
| Genetic Counselors | $58,726 |
| Mental Health and Substance Abuse Social Workers | $58,560 |
References
- IPEDS — Integrated Postsecondary Education Data System
- U.S. Department of Education — College Scorecard
- O*NET Online (Bureau of Labor Statistics)
- National Center for Education Statistics
More about our data sources and methodologies.
HealthcareDegreeSearch.com provides higher-education, college and university, degree, program, career, salary, and other helpful information to students, faculty, institutions, and other internet audiences. Presented information and data are subject to change. Inclusion on this website does not imply or represent a direct relationship with the company, school, or brand. Information, though believed correct at time of publication, may not be correct, and no warranty is provided. Contact the schools to verify any information before relying on it. Financial aid may be available for those who qualify. The displayed options may include sponsored or recommended results, not necessarily based on your preferences.
© HealthcareDegreeSearch.com – All Rights Reserved.