Other Rehabilitation Professions at Rutgers University-New Brunswick
If you plan to study Other Rehabilitation Professions, take a look at what Rutgers University-New Brunswick. Get started with the following essential facts.
Rutgers University-New Brunswick is located in New Brunswick, NJ.
In the most recent year for which we have data, 63 other rehabilitation professions graduations were recorded at Rutgers University-New Brunswick.
Featured schools near , edit
Online & Distance Learning at Rutgers University-New Brunswick
Online coursework is an option at Rutgers University-New Brunswick. Among 52,269 students, 3,953 (8%) studied exclusively online and 21,737 (42%) took at least some classes online.
Other Rehabilitation Professions Rankings at Rutgers University-New Brunswick
Rankings can help you compare Rutgers University-New Brunswick’s Other Rehabilitation Professions program against other schools offering the same major.
Bachelor’s-Level Rankings
| Ranking | Scope | Rank |
|---|---|---|
| Best Schools (Quality) | New Jersey | #1 of 1 |
| Best Value | New Jersey | #1 of 1 |
| Best Schools (Quality) | Middle Atlantic (Region) | #3 of 5 |
| Best Schools (Quality) | Nationwide | #3 of 15 |
| Best Value | Middle Atlantic (Region) | #6 of 12 |
| Best Value | Nationwide | #21 of 37 |
Master’s-Level Rankings
| Ranking | Scope | Rank |
|---|---|---|
| Best Schools (Quality) | New Jersey | #1 of 1 |
| Best Value | New Jersey | #1 of 1 |
| Best Schools (Quality) | Middle Atlantic (Region) | #3 of 5 |
| Best Schools (Quality) | Nationwide | #3 of 15 |
| Best Value | Middle Atlantic (Region) | #6 of 12 |
| Best Value | Nationwide | #21 of 37 |
Associate-Level Rankings
| Ranking | Scope | Rank |
|---|---|---|
| Best Schools (Quality) | New Jersey | #1 of 1 |
| Best Value | New Jersey | #1 of 1 |
| Best Schools (Quality) | Middle Atlantic (Region) | #3 of 5 |
| Best Schools (Quality) | Nationwide | #3 of 15 |
| Best Value | Middle Atlantic (Region) | #6 of 12 |
| Best Value | Nationwide | #21 of 37 |
Student Demographics & Diversity
Below you’ll find the student demographics for Other Rehabilitation Professions graduates at Rutgers University-New Brunswick, broken down by degree level.
Looking at the program as a whole, Other Rehabilitation Professions graduates at Rutgers University-New Brunswick are 84% women (53) and 16% men (10).
Other Rehabilitation Professions Associate’s Program at Rutgers University-New Brunswick
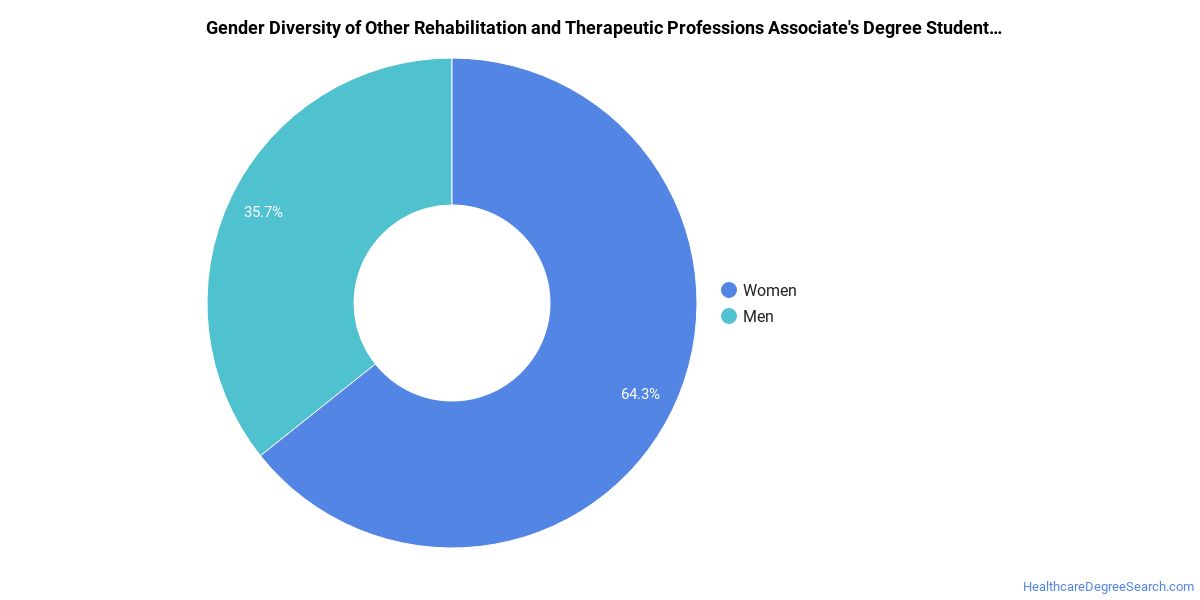
Among the 6 associate’s other rehabilitation professions graduates at Rutgers University-New Brunswick, 100% were women (6) and 0% were men (0).
The following table and chart show the race/ethnicity of Other Rehabilitation Professions associate’s degree recipients at Rutgers University-New Brunswick.
| Race / Ethnicity | Number of Graduates |
|---|---|
| White | 1 |
| Hispanic / Latino | 2 |
| Black / African American | 2 |
| Unknown | 1 |
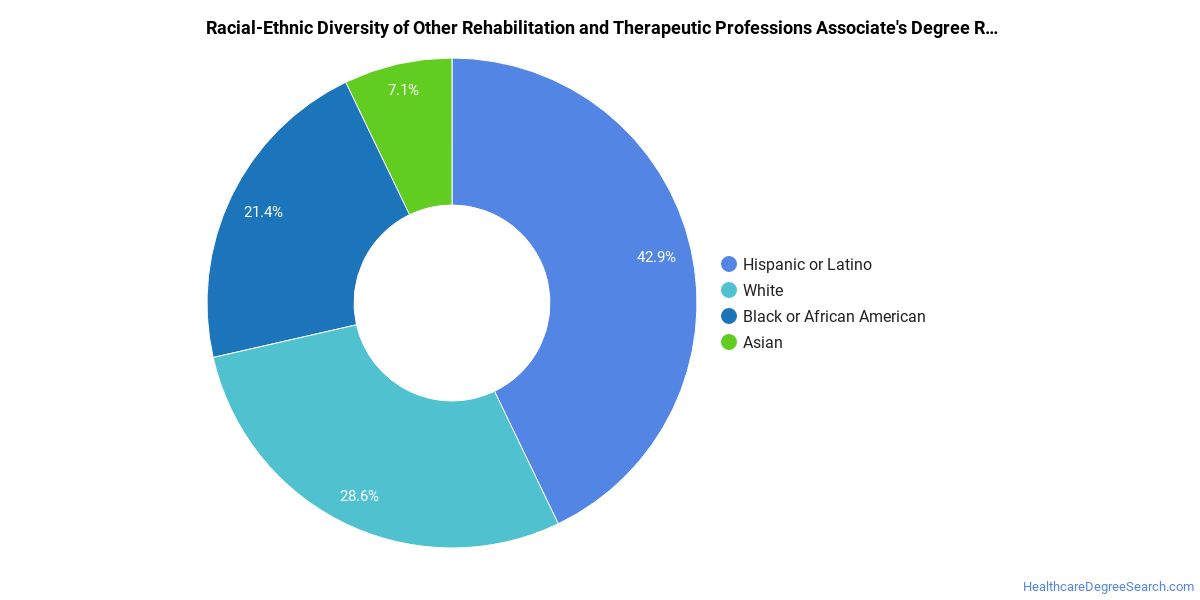
Racial-ethnic minorities make up 67% of Other Rehabilitation Professions associate’s degree recipients at Rutgers University-New Brunswick, higher than the national average of 51%.*
Other Rehabilitation Professions Bachelor’s Program at Rutgers University-New Brunswick
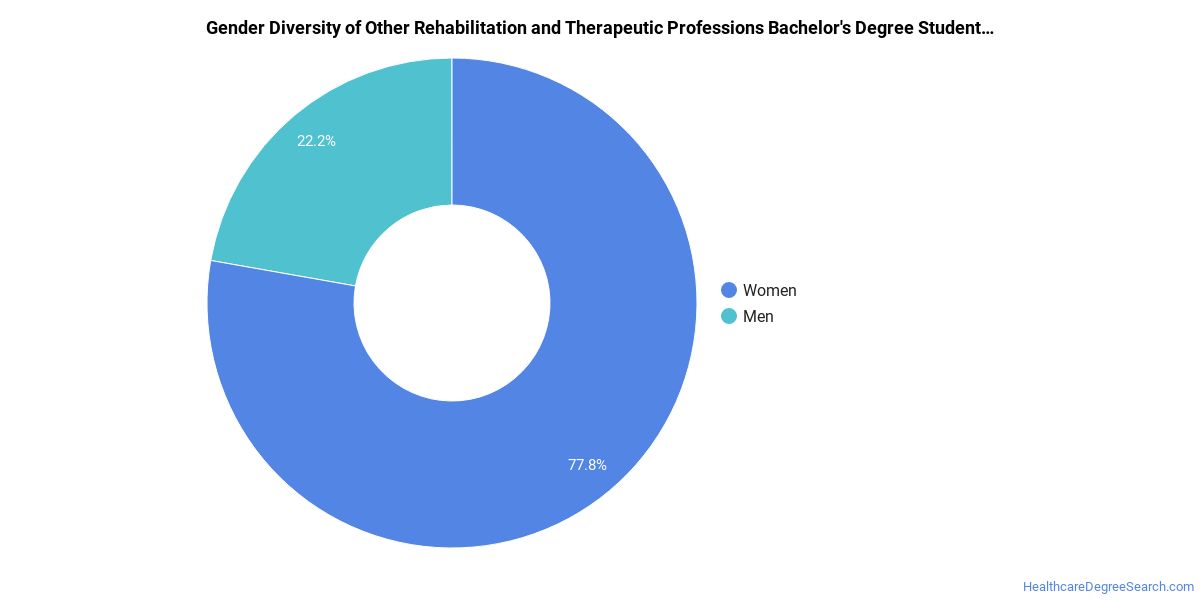
Of the 16 bachelor’s other rehabilitation professions degrees awarded at Rutgers University-New Brunswick, 88% were women (14) and 12% were men (2).
The following table and chart show the race/ethnicity of Other Rehabilitation Professions bachelor’s degree recipients at Rutgers University-New Brunswick.
| Race / Ethnicity | Number of Graduates |
|---|---|
| White | 4 |
| Hispanic / Latino | 8 |
| Black / African American | 2 |
| Asian | 2 |
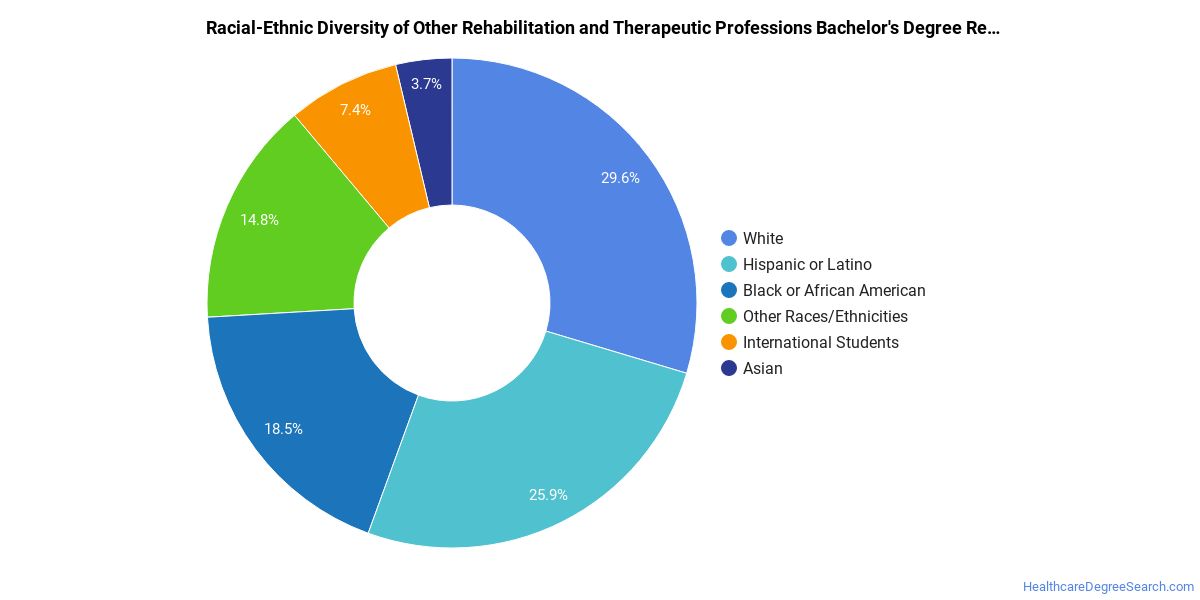
Minority students account for 75% of Other Rehabilitation Professions bachelor’s degree recipients at Rutgers University-New Brunswick, above the national average of 64%.*
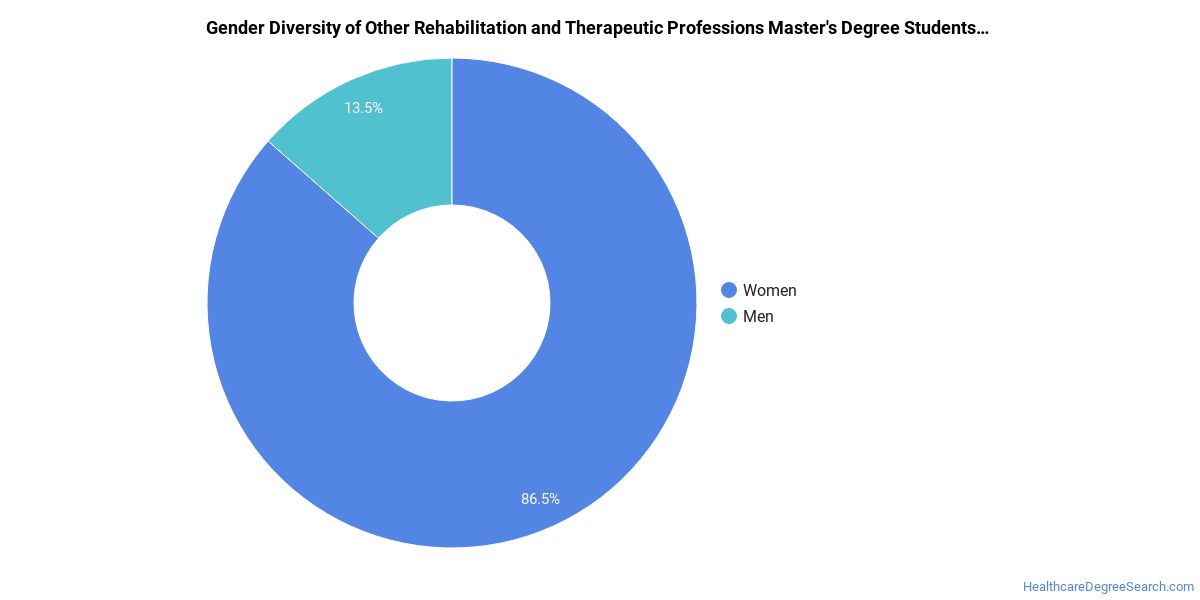
Other Rehabilitation Professions Master’s Program at Rutgers University-New Brunswick
Among the 37 master’s other rehabilitation professions degrees awarded at Rutgers University-New Brunswick, 84% were women (31) and 16% were men (6).
The following table and chart show the race/ethnicity of Other Rehabilitation Professions master’s degree recipients at Rutgers University-New Brunswick.
| Race / Ethnicity | Number of Graduates |
|---|---|
| White | 25 |
| Hispanic / Latino | 7 |
| Black / African American | 1 |
| Asian | 3 |
| Unknown | 1 |
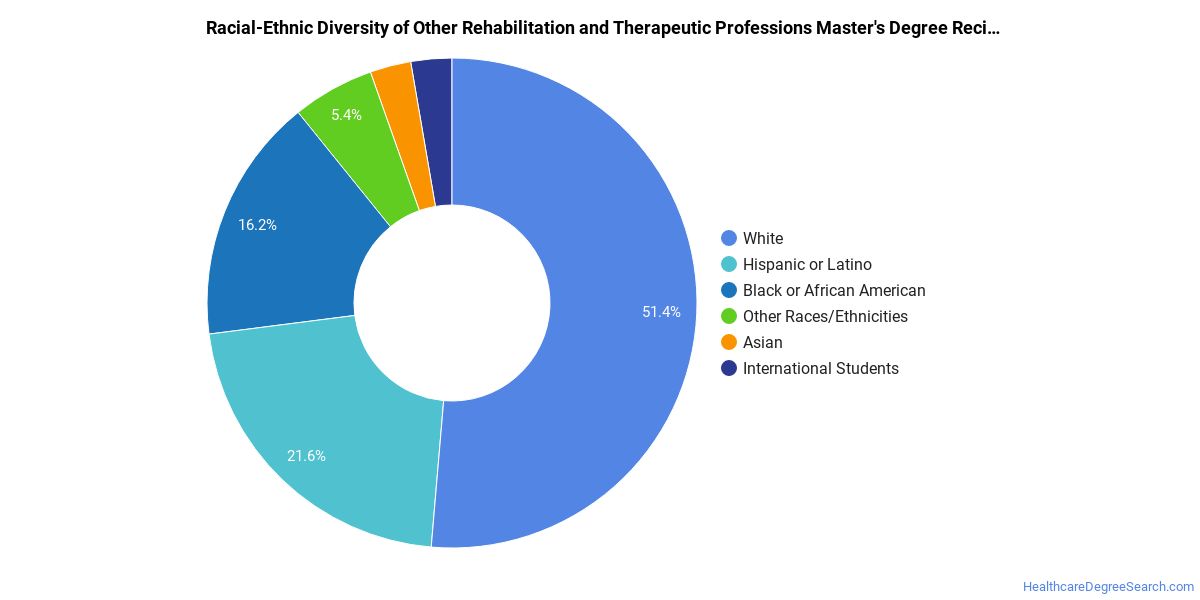
Racial-ethnic minorities make up 30% of Other Rehabilitation Professions master’s degree recipients at Rutgers University-New Brunswick, below the national average of 30%.*
Other Rehabilitation Professions Doctoral Program at Rutgers University-New Brunswick
Of the 4 doctoral other rehabilitation professions degrees awarded at Rutgers University-New Brunswick, 50% were women (2) and 50% were men (2).

The following table and chart show the race/ethnicity of Other Rehabilitation Professions doctoral degree recipients at Rutgers University-New Brunswick.
| Race / Ethnicity | Number of Graduates |
|---|---|
| White | 3 |
| Hispanic / Latino | 1 |

Racial-ethnic minorities make up 25% of Other Rehabilitation Professions doctoral degree recipients at Rutgers University-New Brunswick, above the national average of 12%.*
*The racial-ethnic minorities figure is the total number of graduates minus White, international (nonresident), and unknown-race graduates.
Highest-Paying Careers for Other Rehabilitation Professions Graduates
Students who finish Other Rehabilitation Professions program at Rutgers University-New Brunswick work across a variety of fields. Below are the top-paying careers for Other Rehabilitation Professions majors, ordered by median annual salary:
| Occupation | Nationwide Median Wage |
|---|---|
| Therapists, All Other | $121,750 |
| Music Therapists | $71,670 |
| Health Specialties Teachers, Postsecondary | $46,663 |
| Art Therapists | $40,748 |
References
- IPEDS — Integrated Postsecondary Education Data System
- U.S. Department of Education — College Scorecard
- O*NET Online (Bureau of Labor Statistics)
- National Center for Education Statistics
More about our data sources and methodologies.
HealthcareDegreeSearch.com provides higher-education, college and university, degree, program, career, salary, and other helpful information to students, faculty, institutions, and other internet audiences. Presented information and data are subject to change. Inclusion on this website does not imply or represent a direct relationship with the company, school, or brand. Information, though believed correct at time of publication, may not be correct, and no warranty is provided. Contact the schools to verify any information before relying on it. Financial aid may be available for those who qualify. The displayed options may include sponsored or recommended results, not necessarily based on your preferences.
© HealthcareDegreeSearch.com – All Rights Reserved.