Music Therapy at Saint Mary-of-the-Woods College
What traits are you looking for in a school for Music Therapy, take a look at what Saint Mary-of-the-Woods College. The following information will help you decide if it is a good fit for you.
Saint Mary-of-the-Woods College is in Saint Mary of the Woods, IN.
For the most recent IPEDS reporting year, 44 music therapy graduations were recorded at Saint Mary-of-the-Woods College.
Featured schools near , edit
Online Class Availability at Saint Mary-of-the-Woods College
Distance learning is available at Saint Mary-of-the-Woods College. Of 1,159 students, 413 (36%) were enrolled entirely in distance education and 179 (15%) took at least some classes online.
Music Therapy Rankings at Saint Mary-of-the-Woods College
Rankings can help you compare Saint Mary-of-the-Woods College’s Music Therapy program to other colleges that offer this major.
Bachelor’s-Level Rankings
| Ranking | Scope | Rank |
|---|---|---|
| Best Schools (Quality) | Indiana | #2 of 2 |
| Best Value | Indiana | #5 of 5 |
| Best Schools (Quality) | Great Lakes (Region) | #6 of 6 |
| Best Value | Great Lakes (Region) | #12 of 12 |
| Best Schools (Quality) | Nationwide | #26 of 26 |
| Best Value | Nationwide | #46 of 47 |
Master’s-Level Rankings
| Ranking | Scope | Rank |
|---|---|---|
| Best Schools (Quality) | Indiana | #2 of 2 |
| Best Value | Indiana | #5 of 5 |
| Best Schools (Quality) | Great Lakes (Region) | #6 of 6 |
| Best Value | Great Lakes (Region) | #12 of 12 |
| Best Schools (Quality) | Nationwide | #26 of 26 |
| Best Value | Nationwide | #46 of 47 |
Student Demographics & Diversity
The following sections describe the composition of Music Therapy graduates at Saint Mary-of-the-Woods College, by degree type.
Program-wide, Music Therapy graduates at Saint Mary-of-the-Woods College are 89% women (39) and 11% men (5).
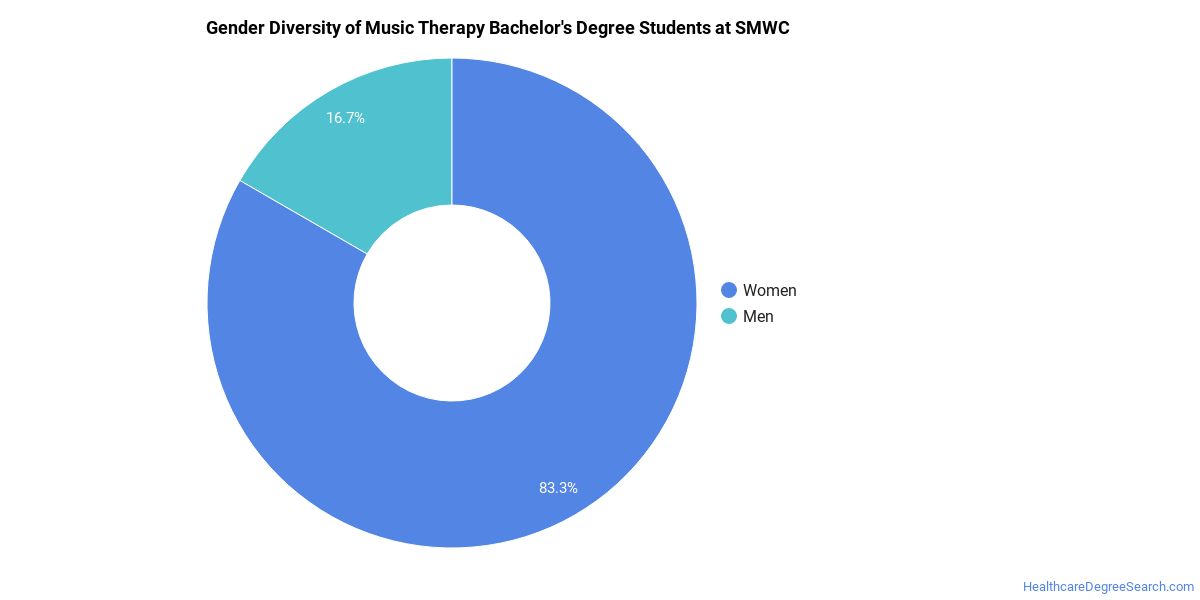
Music Therapy Bachelor’s Program at Saint Mary-of-the-Woods College
Among the 2 bachelor’s music therapy graduates at Saint Mary-of-the-Woods College, 100% were women (2) and 0% were men (0).
The following table and chart show the race/ethnicity of Music Therapy bachelor’s degree recipients at Saint Mary-of-the-Woods College.
| Race / Ethnicity | Number of Graduates |
|---|---|
| White | 1 |
| Asian | 1 |
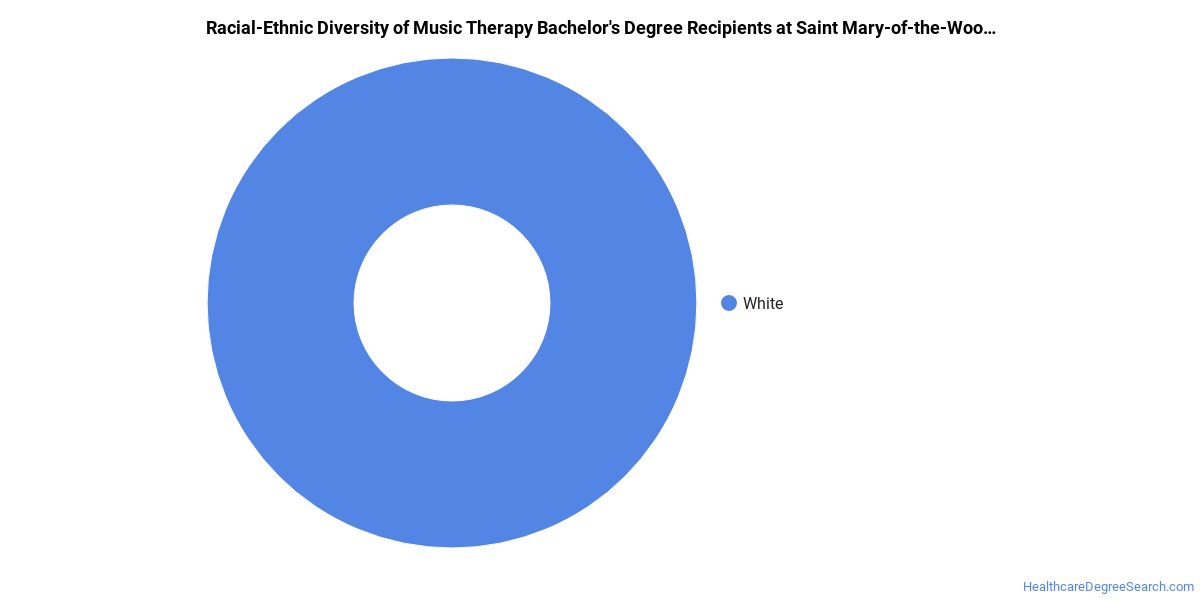
Racial-ethnic minorities make up 50% of Music Therapy bachelor’s degree recipients at Saint Mary-of-the-Woods College, higher than the national average of 23%.*
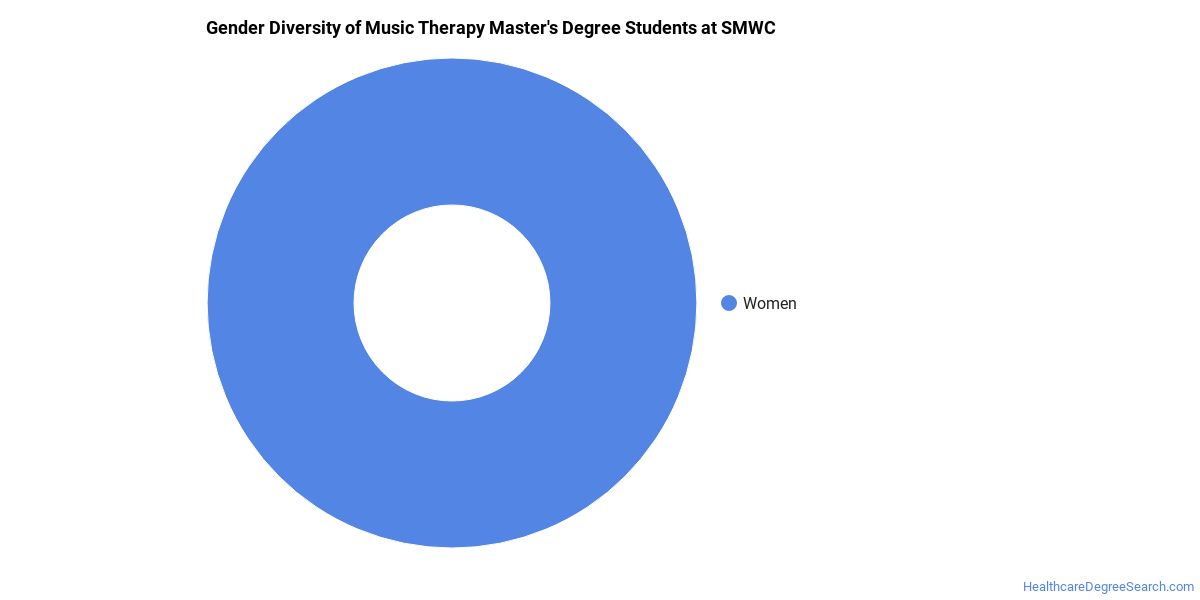
Music Therapy Master’s Program at Saint Mary-of-the-Woods College
Among the 10 master’s music therapy graduates at Saint Mary-of-the-Woods College, 100% were women (10) and 0% were men (0).
The following table and chart show the race/ethnicity of Music Therapy master’s degree recipients at Saint Mary-of-the-Woods College.
| Race / Ethnicity | Number of Graduates |
|---|---|
| White | 8 |
| Black / African American | 1 |
| Unknown | 1 |
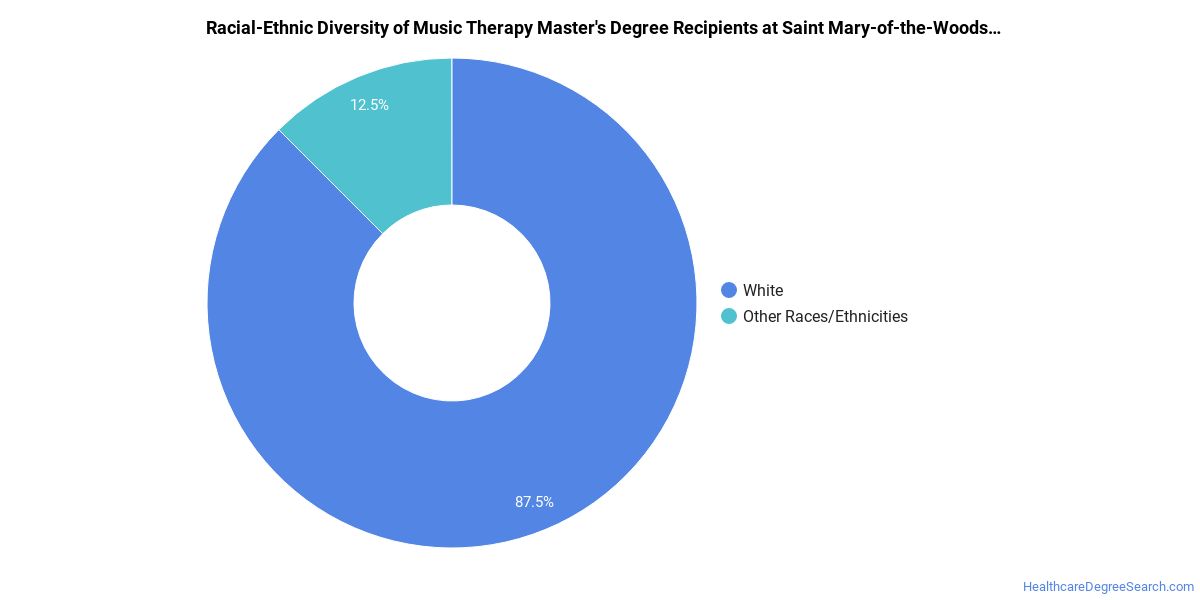
Minority students account for 10% of Music Therapy master’s degree recipients at Saint Mary-of-the-Woods College, lower than the national average of 21%.*
*The racial-ethnic minorities figure is the total number of graduates minus White, international (nonresident), and unknown-race graduates.
Highest-Paying Careers for Music Therapy Graduates
Graduates of the Music Therapy program at Saint Mary-of-the-Woods College go on to a range of careers. Here are the highest-paying careers for Music Therapy graduates, ordered by median annual salary:
| Occupation | Nationwide Median Wage |
|---|---|
| Therapists, All Other | $121,750 |
| Music Therapists | $71,670 |
| Health Specialties Teachers, Postsecondary | $46,663 |
| Art Therapists | $40,748 |
References
- IPEDS — Integrated Postsecondary Education Data System
- U.S. Department of Education — College Scorecard
- O*NET Online (Bureau of Labor Statistics)
- National Center for Education Statistics
More about our data sources and methodologies.
HealthcareDegreeSearch.com provides higher-education, college and university, degree, program, career, salary, and other helpful information to students, faculty, institutions, and other internet audiences. Presented information and data are subject to change. Inclusion on this website does not imply or represent a direct relationship with the company, school, or brand. Information, though believed correct at time of publication, may not be correct, and no warranty is provided. Contact the schools to verify any information before relying on it. Financial aid may be available for those who qualify. The displayed options may include sponsored or recommended results, not necessarily based on your preferences.
© HealthcareDegreeSearch.com – All Rights Reserved.