Mental & Social Health Services at Seattle Central College
If you are interested in studying Mental & Social Health Services, consider the program at Seattle Central College. The following information will help you decide if it is a good fit for you.
Seattle Central College sits in Seattle, WA.
In the most recent year for which we have data, 53 mental & social health services degrees were awarded at Seattle Central College.
Featured schools near , edit
Studying Online at Seattle Central College
Online coursework is an option at Seattle Central College. Of 5,396 students, 1,850 (34%) were enrolled entirely in distance education and 1,544 (29%) took at least some classes online.
Mental & Social Health Services Rankings at Seattle Central College
Use these rankings to compare Seattle Central College’s Mental & Social Health Services program against peer institutions.
Bachelor’s-Level Rankings
| Ranking | Scope | Rank |
|---|---|---|
| Best Value | Washington | #3 of 22 |
| Best Schools (Quality) | Washington | #7 of 23 |
| Best Value | Far Western (Region) | #11 of 71 |
| Best Schools (Quality) | Far Western (Region) | #25 of 82 |
| Best Value | Nationwide | #39 of 514 |
| Best Schools (Quality) | Nationwide | #94 of 530 |
Associate-Level Rankings
| Ranking | Scope | Rank |
|---|---|---|
| Best Value | Washington | #3 of 22 |
| Best Schools (Quality) | Washington | #7 of 23 |
| Best Value | Far Western (Region) | #11 of 71 |
| Best Schools (Quality) | Far Western (Region) | #25 of 82 |
| Best Value | Nationwide | #39 of 514 |
| Best Schools (Quality) | Nationwide | #94 of 530 |
Student Demographics & Diversity
Take a look at the diversity of Mental & Social Health Services graduates at Seattle Central College, by degree type.
Across all degree levels, Mental & Social Health Services graduates at Seattle Central College are 66% women (35) and 34% men (18).
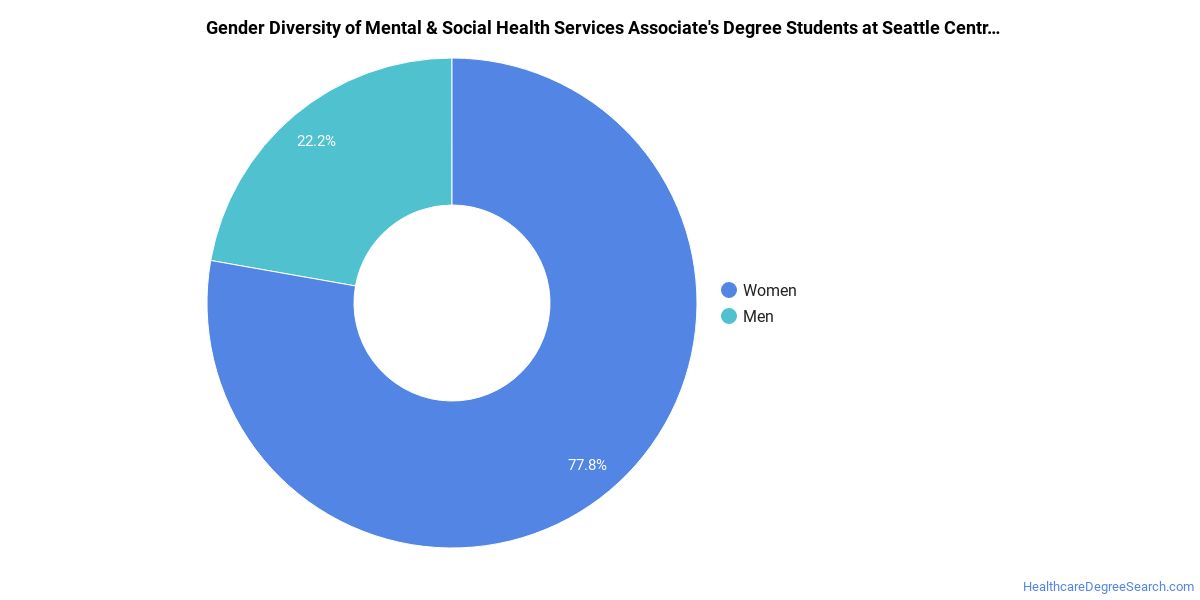
Mental & Social Health Services Associate’s Program at Seattle Central College
Among the 15 associate’s mental & social health services graduates at Seattle Central College, 73% were women (11) and 27% were men (4).
The following table and chart show the race/ethnicity of Mental & Social Health Services associate’s degree recipients at Seattle Central College.
| Race / Ethnicity | Number of Graduates |
|---|---|
| White | 9 |
| Black / African American | 2 |
| Asian | 1 |
| Native Hawaiian / Pacific Islander | 1 |
| Two or More Races | 2 |
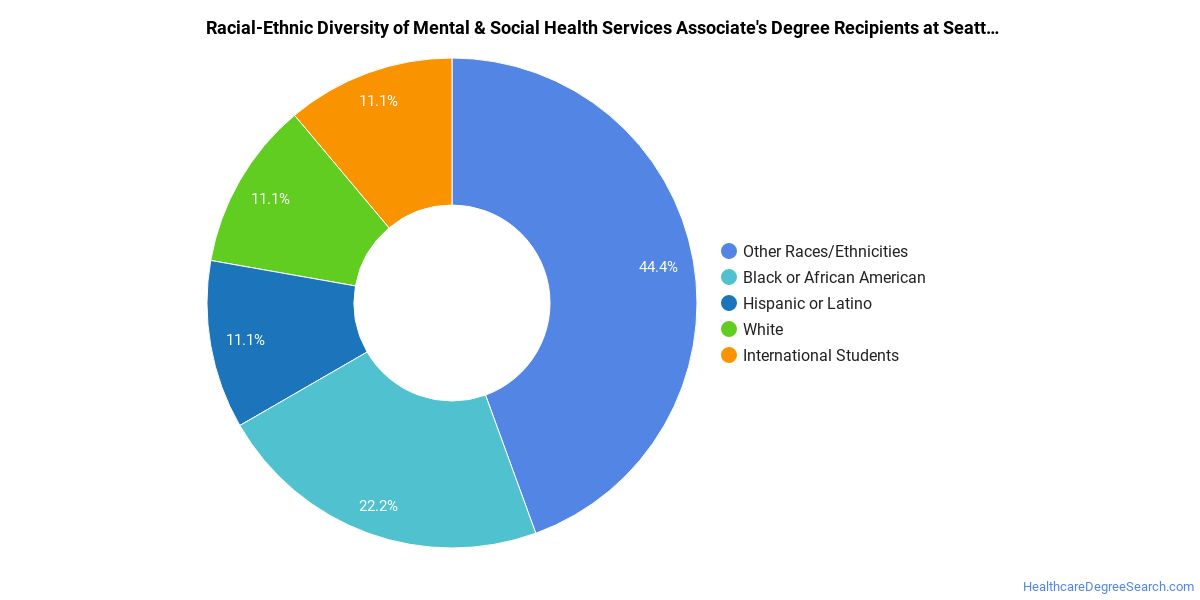
Minority students account for 40% of Mental & Social Health Services associate’s degree recipients at Seattle Central College, below the national average of 48%.*
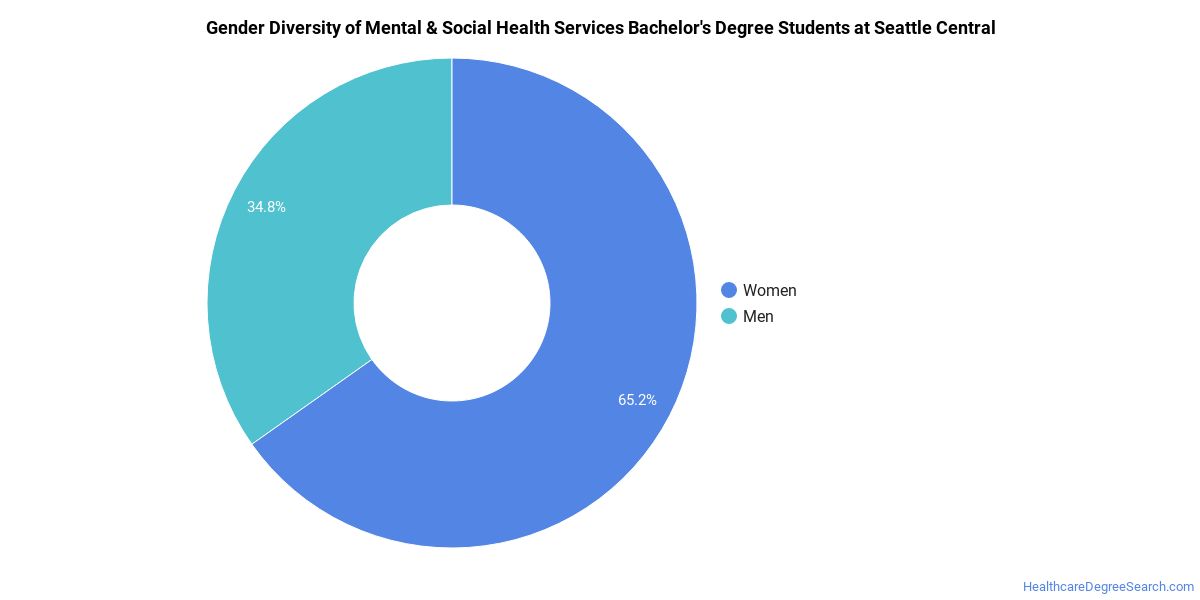
Mental & Social Health Services Bachelor’s Program at Seattle Central College
Among the 22 bachelor’s mental & social health services degrees awarded at Seattle Central College, 82% were women (18) and 18% were men (4).
The following table and chart show the race/ethnicity of Mental & Social Health Services bachelor’s degree recipients at Seattle Central College.
| Race / Ethnicity | Number of Graduates |
|---|---|
| White | 5 |
| Hispanic / Latino | 4 |
| Black / African American | 4 |
| Asian | 1 |
| American Indian / Alaska Native | 1 |
| Native Hawaiian / Pacific Islander | 1 |
| Two or More Races | 5 |
| International (Nonresident) | 1 |
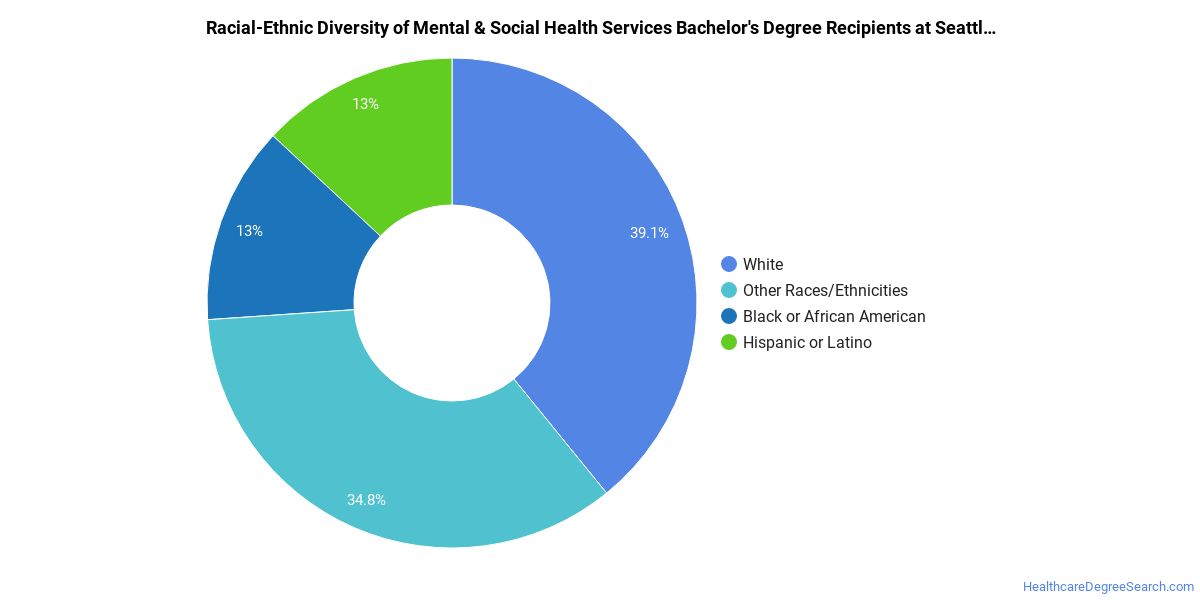
Minority students account for 73% of Mental & Social Health Services bachelor’s degree recipients at Seattle Central College, higher than the national average of 41%.*
*The racial-ethnic minorities figure is the total number of graduates minus White, international (nonresident), and unknown-race graduates.
More Specific Mental & Social Health Services Concentrations at Seattle Central College
The Mental & Social Health Services program at Seattle Central College offers more specialized concentrations:
| Concentration | Graduates |
|---|---|
| Substance Abuse/Addiction Counseling | 10 |
| Clinical/Medical Social Work | 10 |
| Community Health Services/Counseling | 22 |
| Other Mental Health Services | 11 |
Highest-Paying Careers for Mental & Social Health Services Graduates
Those who complete Mental & Social Health Services program at Seattle Central College pursue many career paths. The table below ranks the highest-paying careers for Mental & Social Health Services graduates, ordered by median annual salary:
| Occupation | Nationwide Median Wage |
|---|---|
| Psychology Teachers, Postsecondary | $98,479 |
| Counselors, All Other | $81,766 |
| Health Education Specialists | $81,726 |
| Healthcare Social Workers | $78,044 |
| Marriage and Family Therapists | $74,325 |
| Community Health Workers | $73,901 |
| Mental Health Counselors | $72,983 |
| Social Work Teachers, Postsecondary | $65,510 |
| Genetic Counselors | $58,726 |
| Mental Health and Substance Abuse Social Workers | $58,560 |
References
- IPEDS — Integrated Postsecondary Education Data System
- U.S. Department of Education — College Scorecard
- O*NET Online (Bureau of Labor Statistics)
- National Center for Education Statistics
More about our data sources and methodologies.
HealthcareDegreeSearch.com provides higher-education, college and university, degree, program, career, salary, and other helpful information to students, faculty, institutions, and other internet audiences. Presented information and data are subject to change. Inclusion on this website does not imply or represent a direct relationship with the company, school, or brand. Information, though believed correct at time of publication, may not be correct, and no warranty is provided. Contact the schools to verify any information before relying on it. Financial aid may be available for those who qualify. The displayed options may include sponsored or recommended results, not necessarily based on your preferences.
© HealthcareDegreeSearch.com – All Rights Reserved.