Mental & Social Health Services at SUNY Brockport
If you plan to study Mental & Social Health Services, consider the program at SUNY Brockport. We’ve gathered the following information to help you decide.
SUNY Brockport sits in Brockport, NY.
For the most recent IPEDS reporting year, 33 mental & social health services graduations were recorded at SUNY Brockport.
Featured schools near , edit
Online & Distance Learning at SUNY Brockport
Distance learning is available at SUNY Brockport. Among 7,482 students, 1,704 (23%) were enrolled entirely in distance education and 2,140 (29%) took at least some classes online.
Mental & Social Health Services Rankings at SUNY Brockport
Use these rankings to compare SUNY Brockport’s Mental & Social Health Services program against peer institutions.
Bachelor’s-Level Rankings
| Ranking | Scope | Rank |
|---|---|---|
| Best Value | New York | #19 of 43 |
| Best Value | Middle Atlantic (Region) | #38 of 95 |
| Best Schools (Quality) | New York | #39 of 43 |
| Best Schools (Quality) | Middle Atlantic (Region) | #68 of 96 |
| Best Value | Nationwide | #260 of 514 |
| Best Schools (Quality) | Nationwide | #276 of 530 |
Master’s-Level Rankings
| Ranking | Scope | Rank |
|---|---|---|
| Best Value | New York | #19 of 43 |
| Best Value | Middle Atlantic (Region) | #38 of 95 |
| Best Schools (Quality) | New York | #39 of 43 |
| Best Schools (Quality) | Middle Atlantic (Region) | #68 of 96 |
| Best Value | Nationwide | #260 of 514 |
| Best Schools (Quality) | Nationwide | #276 of 530 |
Student Demographics & Diversity
Take a look at the student demographics for Mental & Social Health Services graduates at SUNY Brockport, by degree type.
Looking at the program as a whole, Mental & Social Health Services graduates at SUNY Brockport are 73% women (24) and 27% men (9).
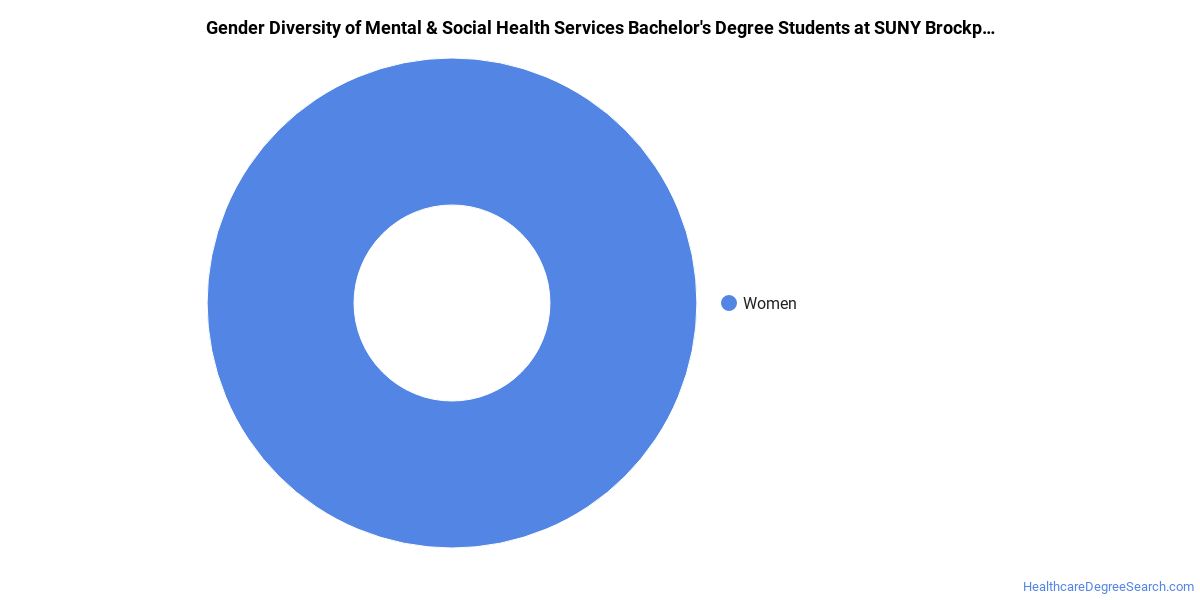
Mental & Social Health Services Bachelor’s Program at SUNY Brockport
Of the 7 bachelor’s mental & social health services graduates at SUNY Brockport, 71% were women (5) and 29% were men (2).
The following table and chart show the race/ethnicity of Mental & Social Health Services bachelor’s degree recipients at SUNY Brockport.
| Race / Ethnicity | Number of Graduates |
|---|---|
| White | 5 |
| Hispanic / Latino | 1 |
| Two or More Races | 1 |

Racial-ethnic minorities make up 29% of Mental & Social Health Services bachelor’s degree recipients at SUNY Brockport, below the national average of 41%.*
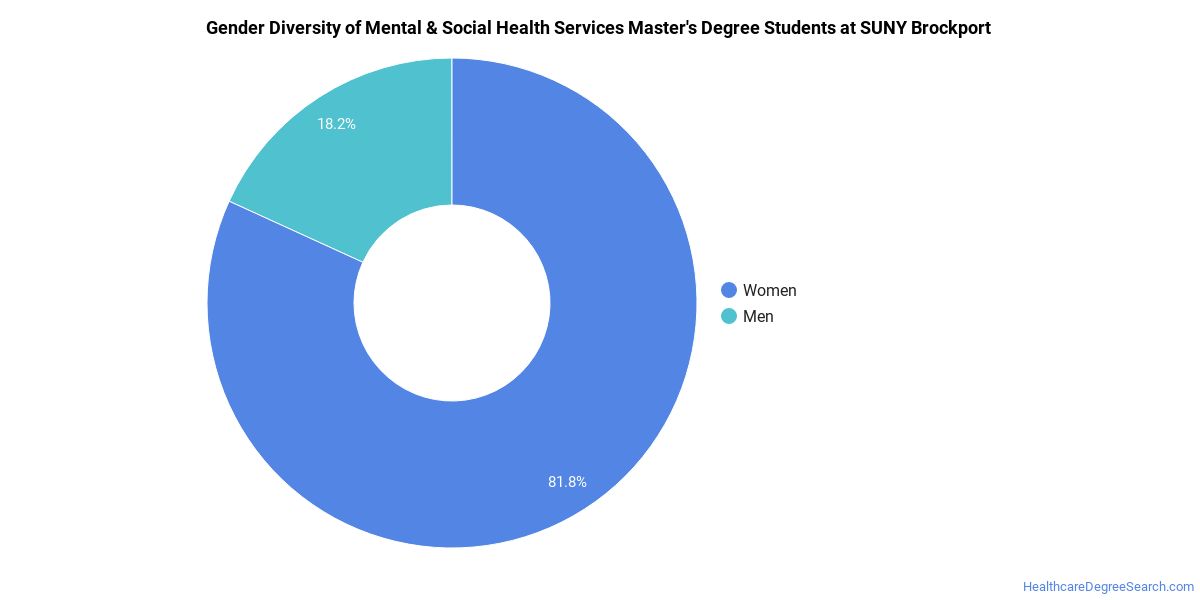
Mental & Social Health Services Master’s Program at SUNY Brockport
Of the 21 master’s mental & social health services graduates at SUNY Brockport, 67% were women (14) and 33% were men (7).
The following table and chart show the race/ethnicity of Mental & Social Health Services master’s degree recipients at SUNY Brockport.
| Race / Ethnicity | Number of Graduates |
|---|---|
| White | 16 |
| Hispanic / Latino | 1 |
| Black / African American | 1 |
| Asian | 2 |
| Two or More Races | 1 |

Minority students account for 24% of Mental & Social Health Services master’s degree recipients at SUNY Brockport, below the national average of 37%.*
*The racial-ethnic minorities figure is the total number of graduates minus White, international (nonresident), and unknown-race graduates.
More Specific Mental & Social Health Services Concentrations at SUNY Brockport
The Mental & Social Health Services program at SUNY Brockport breaks down into more specific concentrations:
| Concentration | Graduates |
|---|---|
| Substance Abuse/Addiction Counseling | 7 |
| Mental Health Counseling | 26 |
Best-Paid Careers for Mental & Social Health Services Graduates
Students who finish Mental & Social Health Services program at SUNY Brockport pursue many career paths. Below are the highest-paying careers for Mental & Social Health Services graduates, ordered by median annual salary:
| Occupation | Nationwide Median Wage |
|---|---|
| Psychology Teachers, Postsecondary | $98,479 |
| Counselors, All Other | $81,766 |
| Health Education Specialists | $81,726 |
| Healthcare Social Workers | $78,044 |
| Marriage and Family Therapists | $74,325 |
| Community Health Workers | $73,901 |
| Mental Health Counselors | $72,983 |
| Social Work Teachers, Postsecondary | $65,510 |
| Genetic Counselors | $58,726 |
| Mental Health and Substance Abuse Social Workers | $58,560 |
References
- IPEDS — Integrated Postsecondary Education Data System
- U.S. Department of Education — College Scorecard
- O*NET Online (Bureau of Labor Statistics)
- National Center for Education Statistics
More about our data sources and methodologies.
HealthcareDegreeSearch.com provides higher-education, college and university, degree, program, career, salary, and other helpful information to students, faculty, institutions, and other internet audiences. Presented information and data are subject to change. Inclusion on this website does not imply or represent a direct relationship with the company, school, or brand. Information, though believed correct at time of publication, may not be correct, and no warranty is provided. Contact the schools to verify any information before relying on it. Financial aid may be available for those who qualify. The displayed options may include sponsored or recommended results, not necessarily based on your preferences.
© HealthcareDegreeSearch.com – All Rights Reserved.