Mental & Social Health Services at University of Cincinnati-Main Campus
If you plan to study Mental & Social Health Services, you may want to check out the program at University of Cincinnati-Main Campus. We’ve gathered the following information to help you decide.
University of Cincinnati-Main Campus is located in Cincinnati, OH.
During the most recent reporting year, 69 mental & social health services degrees were granted at University of Cincinnati-Main Campus.
Featured schools near , edit
Online & Distance Learning at University of Cincinnati-Main Campus
Many students take online classes at University of Cincinnati-Main Campus. Of 45,026 students, 9,022 (20%) studied exclusively online and 19,145 (43%) took at least some classes online.
Mental & Social Health Services Rankings at University of Cincinnati-Main Campus
Rankings can help you compare University of Cincinnati-Main Campus’s Mental & Social Health Services program to other colleges that offer this major.
Bachelor’s-Level Rankings
| Ranking | Scope | Rank |
|---|---|---|
| Best Schools (Quality) | Ohio | #11 of 24 |
| Best Value | Ohio | #19 of 24 |
| Best Schools (Quality) | Great Lakes (Region) | #40 of 81 |
| Best Value | Great Lakes (Region) | #68 of 80 |
| Best Schools (Quality) | Nationwide | #281 of 530 |
| Best Value | Nationwide | #392 of 514 |
Master’s-Level Rankings
| Ranking | Scope | Rank |
|---|---|---|
| Best Schools (Quality) | Ohio | #11 of 24 |
| Best Value | Ohio | #19 of 24 |
| Best Schools (Quality) | Great Lakes (Region) | #40 of 81 |
| Best Value | Great Lakes (Region) | #68 of 80 |
| Best Schools (Quality) | Nationwide | #281 of 530 |
| Best Value | Nationwide | #392 of 514 |
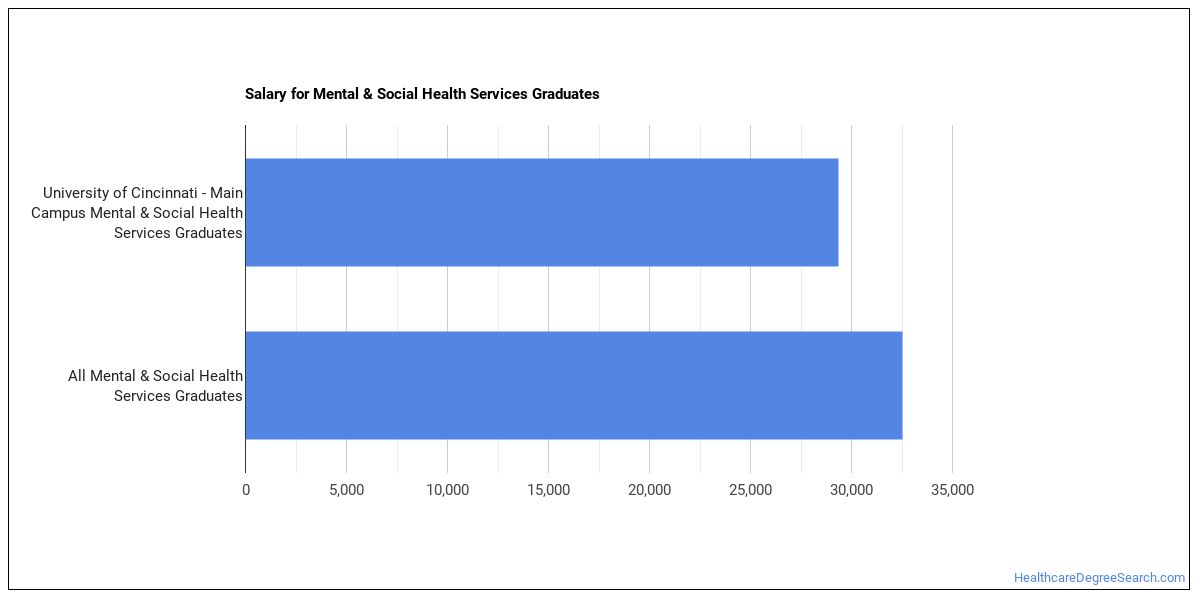
Earnings for Mental & Social Health Services Graduates from University of Cincinnati-Main Campus
Those who finish University of Cincinnati-Main Campus’s Mental & Social Health Services program earn at the following median levels (per the U.S. Department of Education’s College Scorecard):
| Years After Graduation | Median Earnings |
|---|---|
| 1 year | $33,586 |
| 2 years | $37,012 |
| 3 years | $41,294 |
| 5 years | $44,522 |
Median Debt at Graduation
Typical debt at graduation for Mental & Social Health Services graduates from University of Cincinnati-Main Campus stands at $53,508.
Student Demographics & Diversity
The following sections describe the diversity of Mental & Social Health Services graduates at University of Cincinnati-Main Campus, by degree type.
Looking at the program as a whole, Mental & Social Health Services graduates at University of Cincinnati-Main Campus are 81% women (56) and 19% men (13).
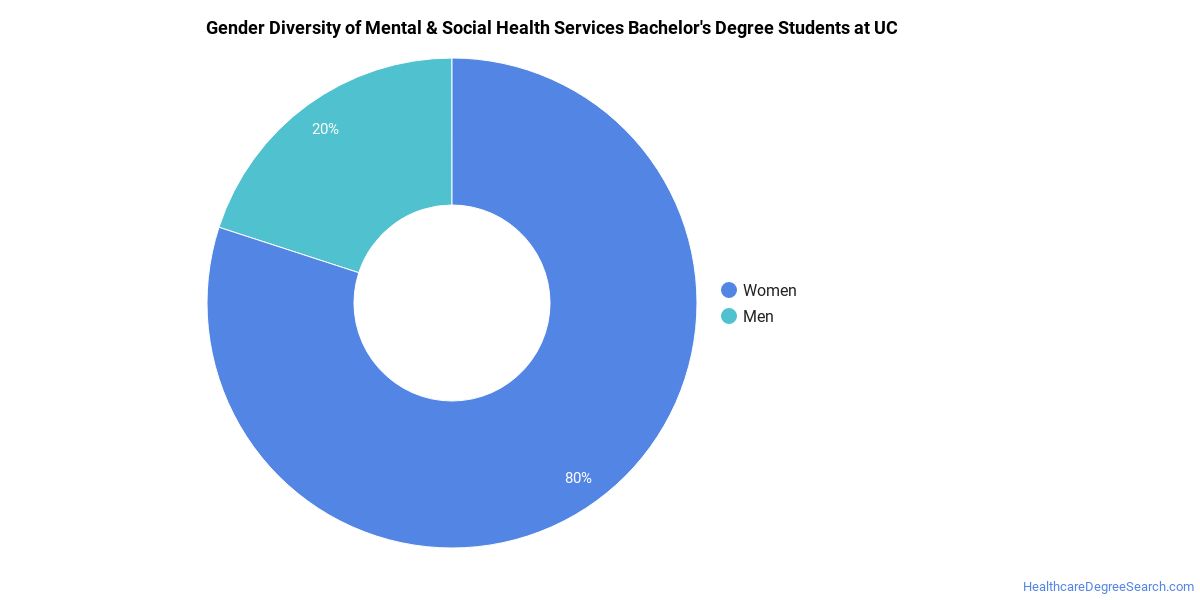
Mental & Social Health Services Bachelor’s Program at University of Cincinnati-Main Campus
Among the 16 bachelor’s mental & social health services graduates at University of Cincinnati-Main Campus, 81% were women (13) and 19% were men (3).
The following table and chart show the race/ethnicity of Mental & Social Health Services bachelor’s degree recipients at University of Cincinnati-Main Campus.
| Race / Ethnicity | Number of Graduates |
|---|---|
| White | 9 |
| Hispanic / Latino | 1 |
| American Indian / Alaska Native | 1 |
| Unknown | 5 |
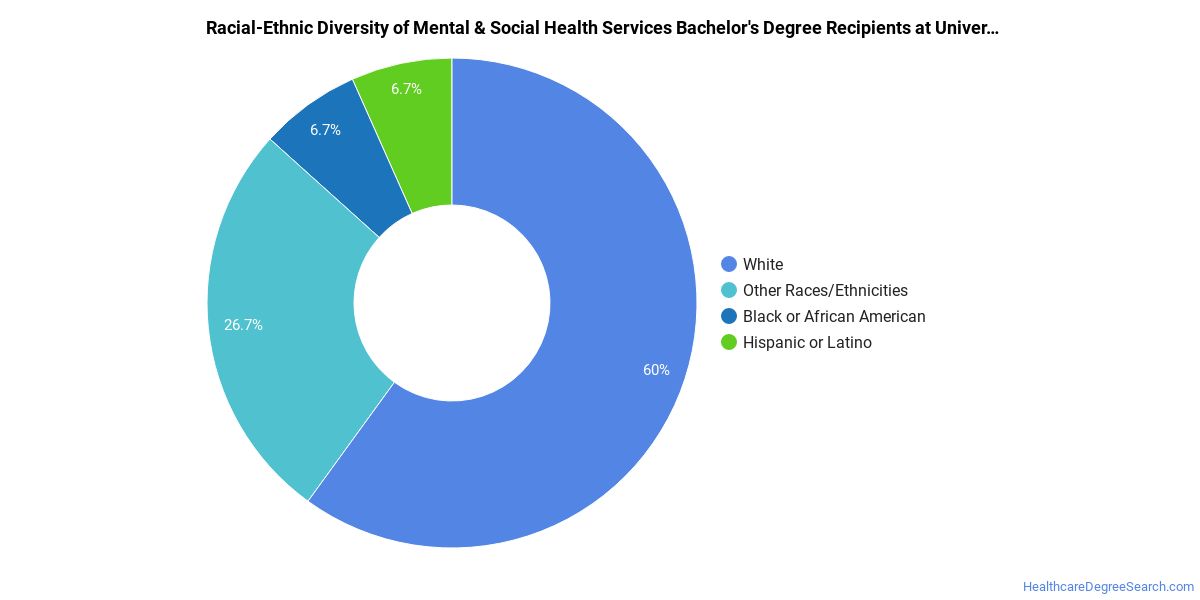
Minority students account for 12% of Mental & Social Health Services bachelor’s degree recipients at University of Cincinnati-Main Campus, lower than the national average of 41%.*
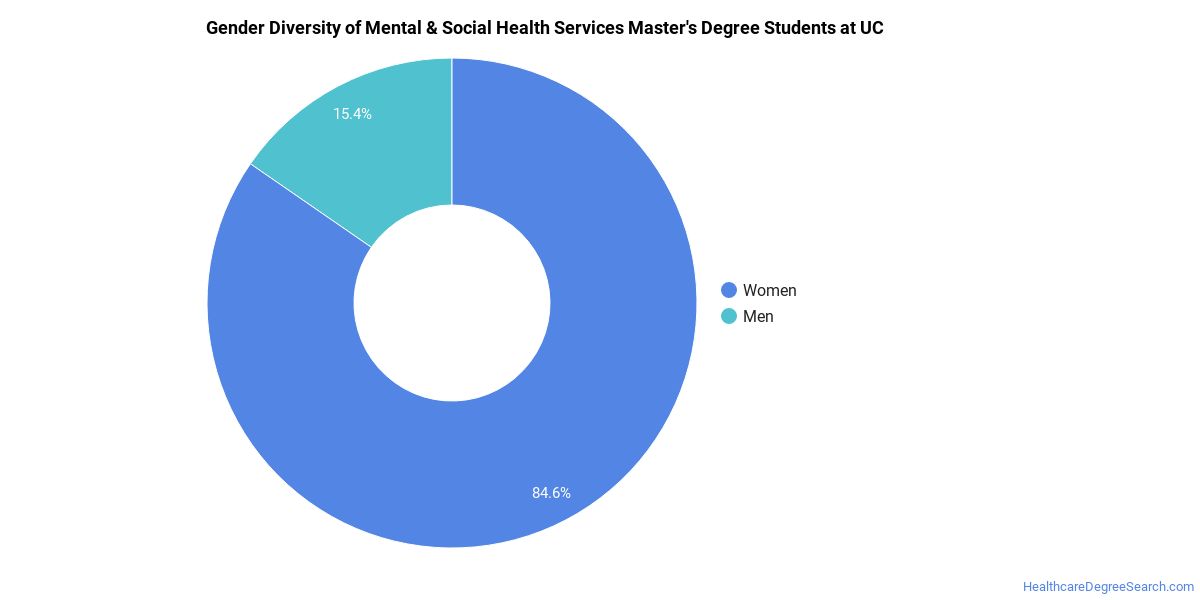
Mental & Social Health Services Master’s Program at University of Cincinnati-Main Campus
Among the 20 master’s mental & social health services graduates at University of Cincinnati-Main Campus, 80% were women (16) and 20% were men (4).
The following table and chart show the race/ethnicity of Mental & Social Health Services master’s degree recipients at University of Cincinnati-Main Campus.
| Race / Ethnicity | Number of Graduates |
|---|---|
| White | 12 |
| Hispanic / Latino | 2 |
| Black / African American | 3 |
| Two or More Races | 3 |
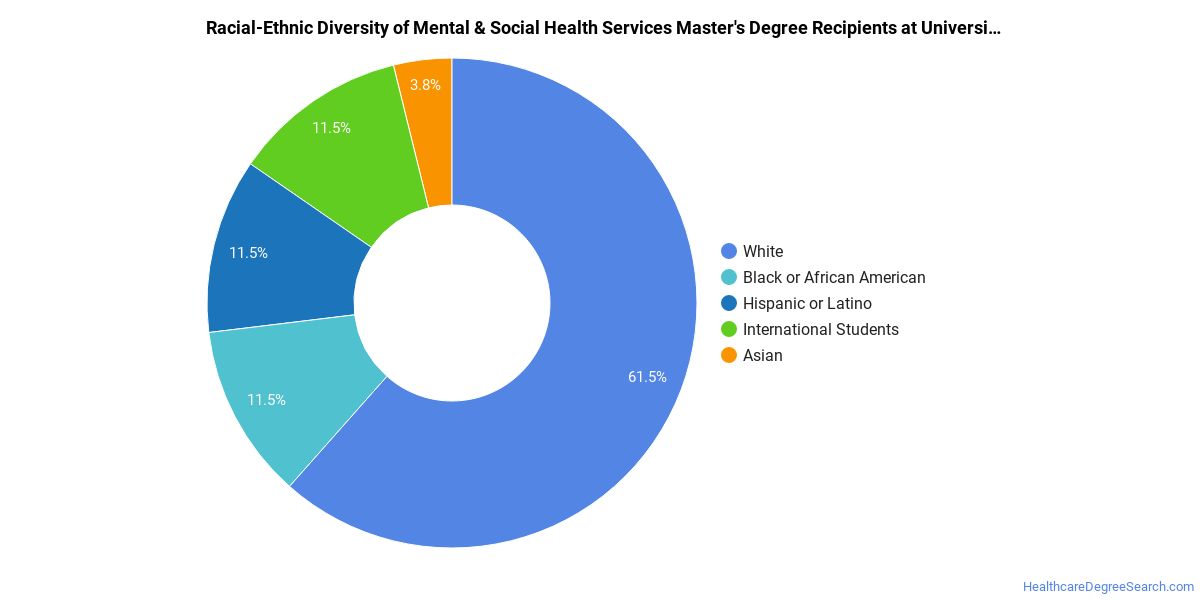
Minority students account for 40% of Mental & Social Health Services master’s degree recipients at University of Cincinnati-Main Campus, above the national average of 37%.*
*The racial-ethnic minorities figure is the total number of graduates minus White, international (nonresident), and unknown-race graduates.
More Specific Mental & Social Health Services Concentrations at University of Cincinnati-Main Campus
The Mental & Social Health Services program at University of Cincinnati-Main Campus breaks down into more specific concentrations:
| Concentration | Graduates |
|---|---|
| Substance Abuse/Addiction Counseling | 43 |
| Mental Health Counseling | 19 |
| Other Mental Health Services | 7 |
Best-Paid Careers for Mental & Social Health Services Graduates
Graduates of the Mental & Social Health Services program at University of Cincinnati-Main Campus go on to a range of careers. Below are the highest-paying careers for Mental & Social Health Services majors, ordered by median annual salary:
| Occupation | Nationwide Median Wage |
|---|---|
| Psychology Teachers, Postsecondary | $98,479 |
| Counselors, All Other | $81,766 |
| Health Education Specialists | $81,726 |
| Healthcare Social Workers | $78,044 |
| Marriage and Family Therapists | $74,325 |
| Community Health Workers | $73,901 |
| Mental Health Counselors | $72,983 |
| Social Work Teachers, Postsecondary | $65,510 |
| Genetic Counselors | $58,726 |
| Mental Health and Substance Abuse Social Workers | $58,560 |
References
- IPEDS — Integrated Postsecondary Education Data System
- U.S. Department of Education — College Scorecard
- O*NET Online (Bureau of Labor Statistics)
- National Center for Education Statistics
More about our data sources and methodologies.
HealthcareDegreeSearch.com provides higher-education, college and university, degree, program, career, salary, and other helpful information to students, faculty, institutions, and other internet audiences. Presented information and data are subject to change. Inclusion on this website does not imply or represent a direct relationship with the company, school, or brand. Information, though believed correct at time of publication, may not be correct, and no warranty is provided. Contact the schools to verify any information before relying on it. Financial aid may be available for those who qualify. The displayed options may include sponsored or recommended results, not necessarily based on your preferences.
© HealthcareDegreeSearch.com – All Rights Reserved.