Mental & Social Health Services at Northwood Technical College
If you are interested in studying Mental & Social Health Services, you may want to check out the program at Northwood Technical College. The following information will help you decide if it is a good fit for you.
Northwood Technical College is in Rice Lake, WI.
During the most recent reporting year, 59 mental & social health services degrees were granted at Northwood Technical College.
Featured schools near , edit
Online & Distance Learning at Northwood Technical College
Many students take online classes at Northwood Technical College. Among 2,940 students, 526 (18%) studied exclusively online and 1,513 (51%) took at least some classes online.
Mental & Social Health Services Rankings at Northwood Technical College
Rankings can help you compare Northwood Technical College’s Mental & Social Health Services program against other schools offering the same major.
Associate-Level Rankings
| Ranking | Scope | Rank |
|---|---|---|
| Best Value | Wisconsin | #1 of 17 |
| Best Schools (Quality) | Wisconsin | #3 of 17 |
| Best Value | Great Lakes (Region) | #8 of 80 |
| Best Schools (Quality) | Great Lakes (Region) | #21 of 81 |
| Best Value | Nationwide | #122 of 514 |
| Best Schools (Quality) | Nationwide | #157 of 530 |
Earnings for Mental & Social Health Services Graduates from Northwood Technical College
Students who complete Northwood Technical College’s Mental & Social Health Services program earn the following amounts (per the U.S. Department of Education’s College Scorecard):

| Years After Graduation | Median Earnings |
|---|---|
| 1 year | $20,951 |
| 4 years | $38,435 |
| 5 years | $38,710 |
Is this above or below average for the school? Four years after graduating, Mental & Social Health Services graduates from Northwood Technical College report median earnings of $38,435, compared with $40,449 for all Northwood Technical College graduates — about 5% lower than the school-wide median.

Median Debt at Graduation
Typical debt at graduation for Mental & Social Health Services graduates from Northwood Technical College is $11,259.
Student Demographics & Diversity
Below you’ll find the diversity of Mental & Social Health Services graduates at Northwood Technical College, by degree type.
Program-wide, Mental & Social Health Services graduates at Northwood Technical College are 81% women (48) and 19% men (11).
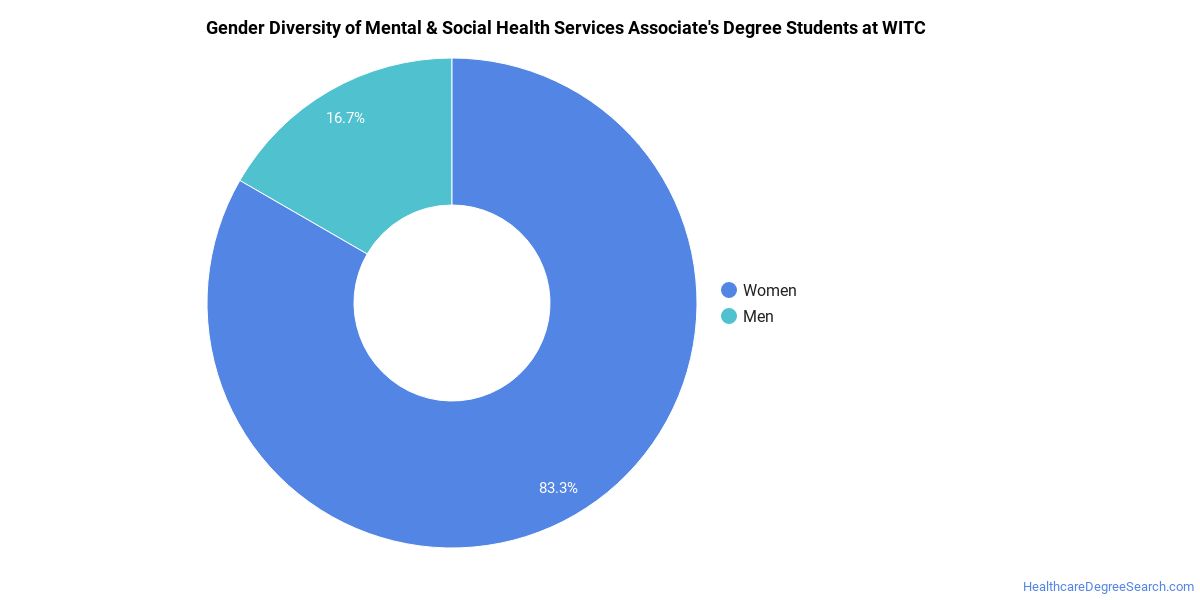
Mental & Social Health Services Associate’s Program at Northwood Technical College
Of the 29 associate’s mental & social health services graduates at Northwood Technical College, 83% were women (24) and 17% were men (5).
The following table and chart show the race/ethnicity of Mental & Social Health Services associate’s degree recipients at Northwood Technical College.
| Race / Ethnicity | Number of Graduates |
|---|---|
| White | 23 |
| Hispanic / Latino | 2 |
| Black / African American | 3 |
| American Indian / Alaska Native | 1 |
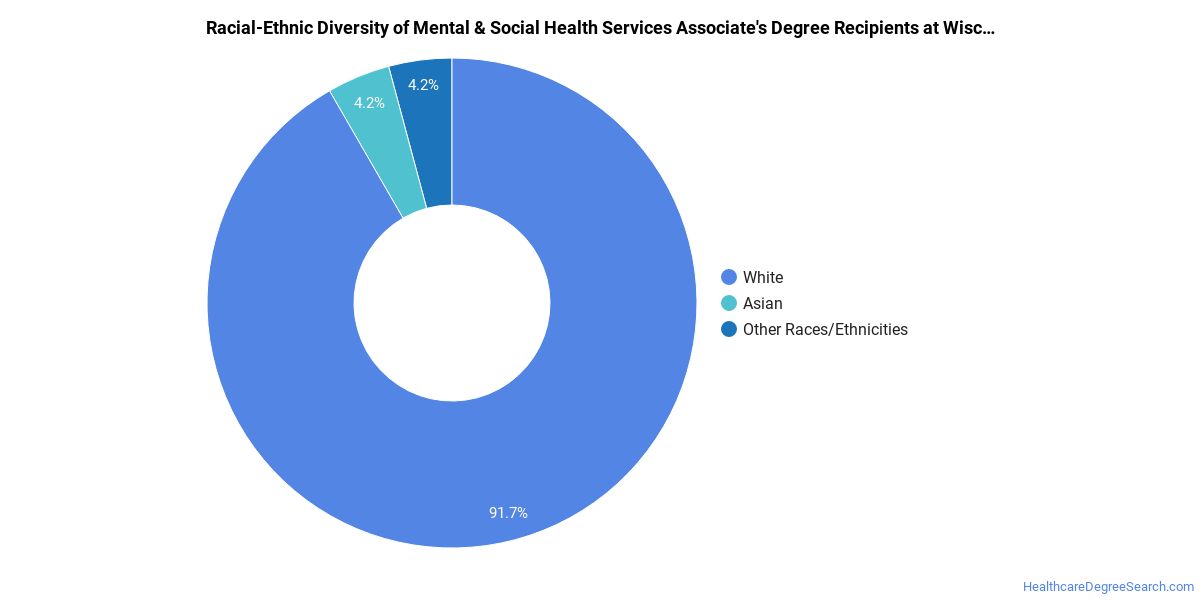
Racial-ethnic minorities make up 21% of Mental & Social Health Services associate’s degree recipients at Northwood Technical College, below the national average of 48%.*
*The racial-ethnic minorities figure is the total number of graduates minus White, international (nonresident), and unknown-race graduates.
More Specific Mental & Social Health Services Concentrations at Northwood Technical College
This Mental & Social Health Services program at Northwood Technical College offers more specialized concentrations:
| Concentration | Graduates |
|---|---|
| Substance Abuse/Addiction Counseling | 30 |
| Mental Health Services Technician | 29 |
Highest-Paying Careers for Mental & Social Health Services Graduates
Those who complete Mental & Social Health Services program at Northwood Technical College pursue many career paths. Here are the top-paying careers for Mental & Social Health Services graduates, ordered by median annual salary:
| Occupation | Nationwide Median Wage |
|---|---|
| Psychology Teachers, Postsecondary | $98,479 |
| Counselors, All Other | $81,766 |
| Health Education Specialists | $81,726 |
| Healthcare Social Workers | $78,044 |
| Marriage and Family Therapists | $74,325 |
| Community Health Workers | $73,901 |
| Mental Health Counselors | $72,983 |
| Social Work Teachers, Postsecondary | $65,510 |
| Genetic Counselors | $58,726 |
| Mental Health and Substance Abuse Social Workers | $58,560 |
References
- IPEDS — Integrated Postsecondary Education Data System
- U.S. Department of Education — College Scorecard
- O*NET Online (Bureau of Labor Statistics)
- National Center for Education Statistics
More about our data sources and methodologies.
HealthcareDegreeSearch.com provides higher-education, college and university, degree, program, career, salary, and other helpful information to students, faculty, institutions, and other internet audiences. Presented information and data are subject to change. Inclusion on this website does not imply or represent a direct relationship with the company, school, or brand. Information, though believed correct at time of publication, may not be correct, and no warranty is provided. Contact the schools to verify any information before relying on it. Financial aid may be available for those who qualify. The displayed options may include sponsored or recommended results, not necessarily based on your preferences.
© HealthcareDegreeSearch.com – All Rights Reserved.