Rehabilitation Science
A program that focuses on human function, disability, and rehabilitation from the perspectives of the health sciences, social sciences, psychology, engineering, and related fields. Includes instruction in psychological, social, and cultural aspects of disability and rehabilitation; sensory and motor function and dysfunction; biomechanics and kinesiology; assistive technology; rehabilitation instrumentation and methodology; statistics; and health and rehabilitation policy.
Featured schools near , edit
Types of Degrees Rehabilitation Science Majors Are Earning
Those studying Rehabilitation Science have the option of earning degrees at several award levels.
| Award Level | Graduates |
|---|---|
| Certificate | 78 |
| Bachelor’s Degree | 846 |
| Master’s Degree | 117 |
| Doctor’s Degree | 66 |
What Rehabilitation Science Majors Need to Know
Studies in Rehabilitation Science develop a specific mix of knowledge, skills, and abilities — derived from O*NET surveys of workers in occupations that Rehabilitation Science graduates commonly enter.
Knowledge Areas
According to O*NET, a major in Rehabilitation Science emphasizes the following knowledge areas:

- Education and Training — Importance 4.7 / 5; level 5.9 / 7.
- English Language — Importance 4.6 / 5; level 5.7 / 7.
- Biology — Importance 4.2 / 5; level 5.0 / 7.
- Medicine and Dentistry — Importance 4.2 / 5; level 4.4 / 7.
- Psychology — Importance 3.8 / 5; level 4.6 / 7.
Importance is rated 1–5; level is 1–7. Source: ONET Online — weighted across related occupations.*
Skills
Skills emphasized by a Rehabilitation Science program reflects the day-to-day work of related occupations:
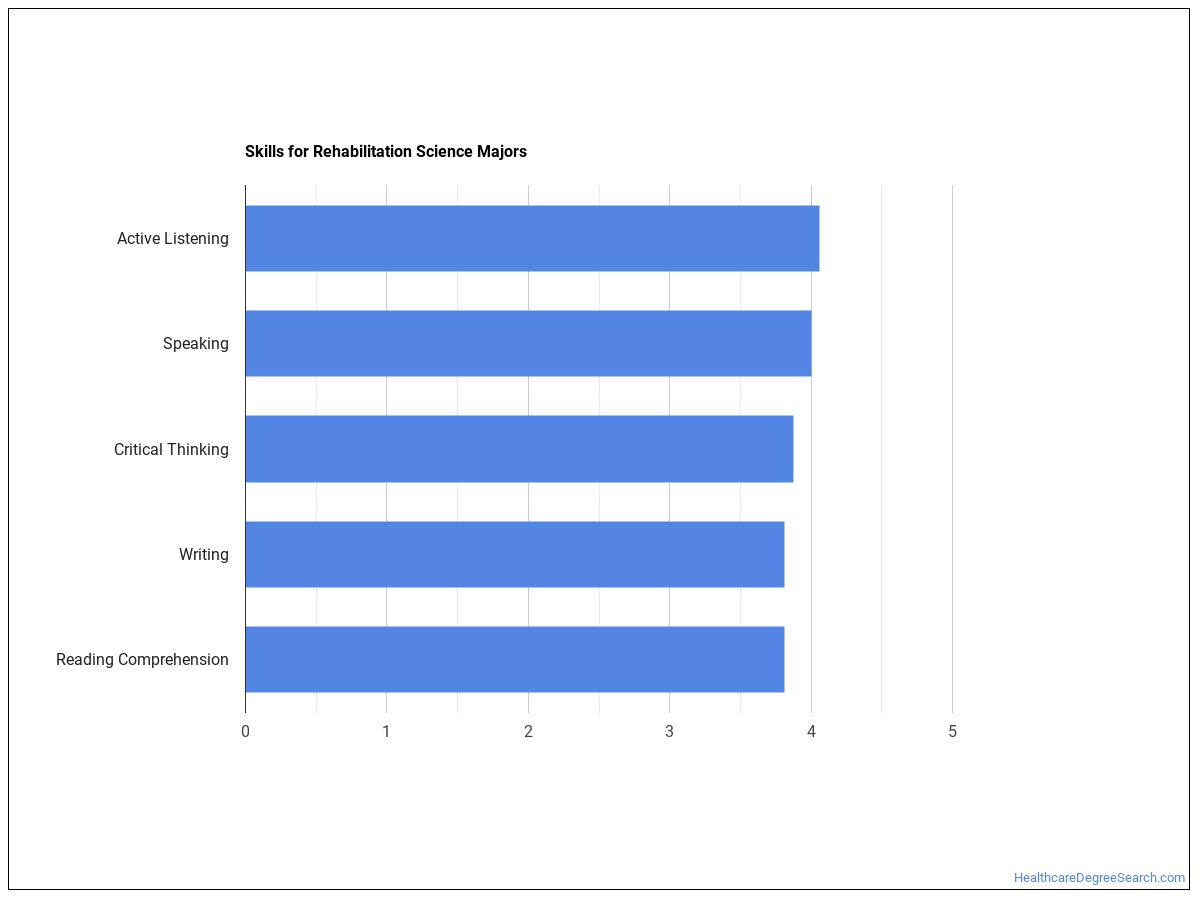
- Speaking — Importance 4.1 / 5; level 4.9 / 7.
- Reading Comprehension — Importance 4.1 / 5; level 5.0 / 7.
- Instructing — Importance 4.1 / 5; level 4.3 / 7.
- Active Listening — Importance 4 / 5; level 4.6 / 7.
- Writing — Importance 4.0 / 5; level 5.0 / 7.
Abilities
The cognitive and physical abilities most relevant to Rehabilitation Science careers — again drawn from O*NET surveys of related occupations:
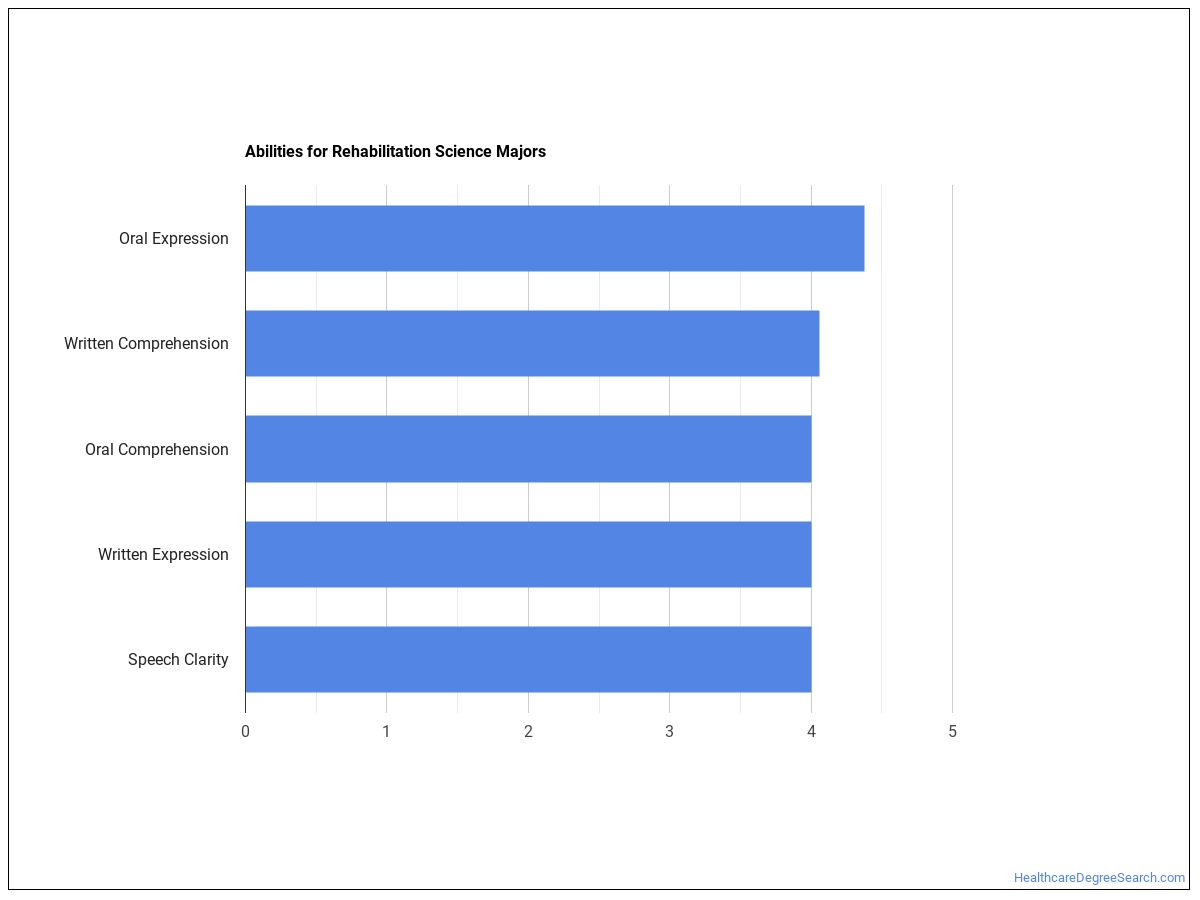
- Oral Expression — Importance 4.7 / 5; level 5.1 / 7.
- Written Comprehension — Importance 4.1 / 5; level 5.0 / 7.
- Oral Comprehension — Importance 4 / 5; level 4.9 / 7.
- Speech Clarity — Importance 4 / 5; level 4.6 / 7.
- Written Expression — Importance 4.0 / 5; level 5.0 / 7.
Common Job Activities
Day-to-day, Rehabilitation Science graduates report doing:
| Activity | Frequency / Importance |
|---|---|
| Training and Teaching Others | 4.5 / 7 |
| Updating and Using Relevant Knowledge | 4.5 / 7 |
| Getting Information | 4.5 / 7 |
| Working with Computers | 4.4 / 7 |
| Thinking Creatively | 4.3 / 7 |
| Establishing and Maintaining Interpersonal Relationships | 4.2 / 7 |
| Organizing, Planning, and Prioritizing Work | 4.2 / 7 |
| Interpreting the Meaning of Information for Others | 4.1 / 7 |
| Making Decisions and Solving Problems | 4.1 / 7 |
| Identifying Objects, Actions, and Events | 4.0 / 7 |
Technology Skills Used on the Job
Most frequently-cited tools used by Rehabilitation Science professionals:
| Tool / Software | Category | In-Demand |
|---|---|---|
| Microsoft Office software | Office suite software | — |
| Web browser software | Internet browser software | — |
| Email software | Electronic mail software | — |
| Microsoft Outlook | Electronic mail software | — |
| Microsoft Word | Word processing software | — |
| Microsoft PowerPoint | Presentation software | — |
| Microsoft Excel | Spreadsheet software | — |
| Material safety data sheet MSDS software | Compliance software | — |
| Medical condition coding software | Medical software | — |
| Course management system software | Computer based training software | — |
| Calendar and scheduling software | Calendar and scheduling software | — |
| Desire2Learn LMS software | Computer based training software | — |
Source: ONET Online technology skills, weighted across related occupations.*
Sample Job Titles
Real job postings for Rehabilitation Science graduates include:
- Inhalation Therapy Teacher
- Home Care and Home Health Aides Teacher
- Assistant Professor
- Mental Health Aides Teacher
- Optometry Teacher
- Dental Assistant Teacher
- Hospital Aides and Assistants Teacher
- College Professor
- Dentistry Professor
- Health Diagnostics Teacher
- Otolaryngology Teacher
- Podiatry Teacher
- Immunology Teacher
- Prosthetic Aides Teacher
- Serology Teacher
What Can You Do With a Rehabilitation Science Degree?
Graduates with a degree in Rehabilitation Science commonly enter the following occupations:
| Occupation | Job Growth | Median Salary | 25th–75th Pctile |
|---|---|---|---|
| Health Specialties Teachers, Postsecondary | 10.7% | $46,663 | $40,304–$53,022 |
| Life Scientists, All Other | -2.5% | $97,541 | $79,942–$115,141 |
| Rehabilitation Counselors | 12.1% | $40,604 | $32,299–$48,909 |
Job-growth = projected employment change for the parent occupation. Source: ONET / BLS Employment Projections.*
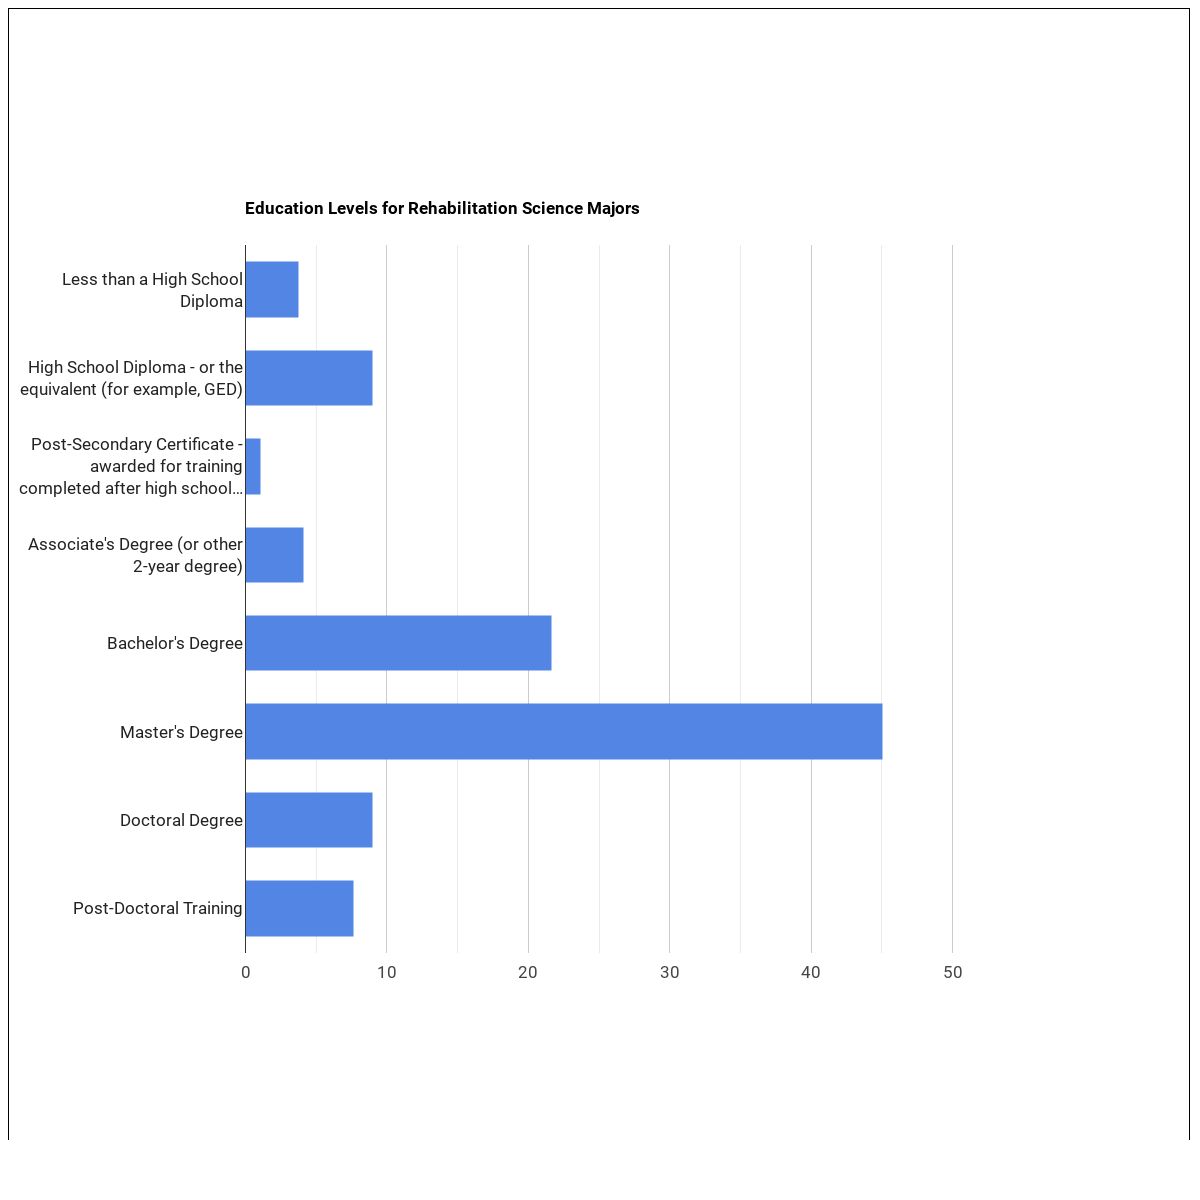
Education Typically Required
Across the occupations open to Rehabilitation Science graduates, the typical level of education actually held by current workers is distributed as:
| Education Level | Share of Workers |
|---|---|
| Master’s degree | 35.7% |
| Doctoral degree | 24.3% |
| Post-doctoral training | 18.7% |
| Bachelor’s degree | 13.6% |
| Associate’s degree (or other 2-year) | 4.5% |
| Postsecondary certificate | 2.8% |
| High school diploma or equivalent | 0.3% |
| Post-master’s certificate | 0.1% |
Source: ONET Online education / training / experience requirements.*
Who Is Earning a Degree in Rehabilitation Science?
Gender Distribution
This field skews predominantly female, with women earning 77.4% of Rehabilitation Science degrees.
| Gender | Graduates | Share |
|---|---|---|
| Women | 857 | 77.4% |
| Men | 250 | 22.6% |
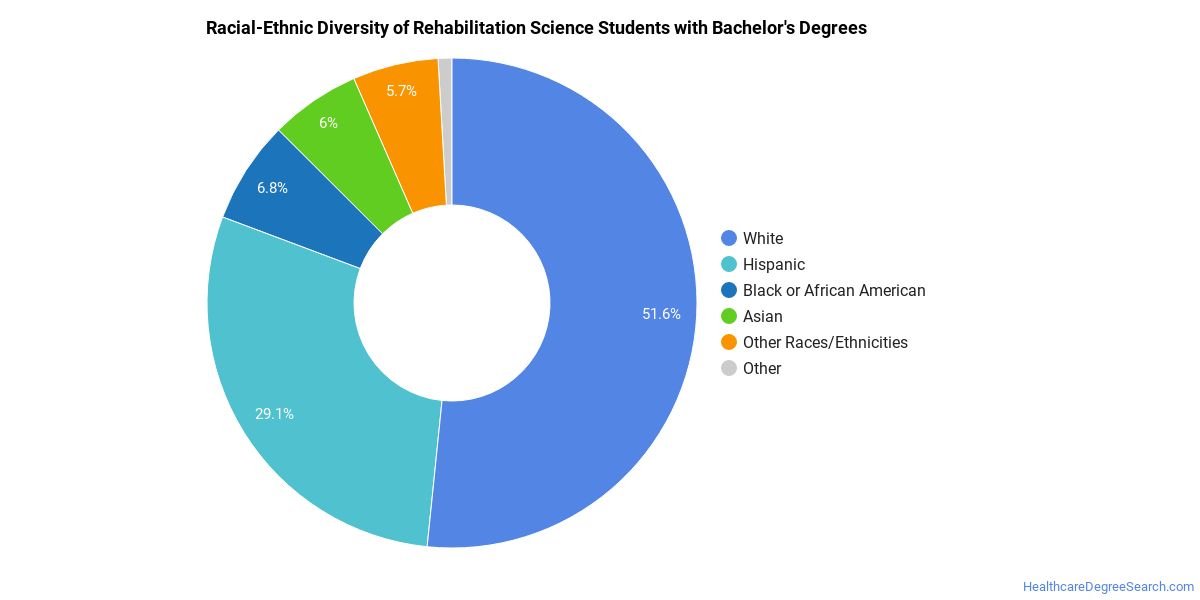
Racial-Ethnic Diversity
At the national level, the racial-ethnic distribution of Rehabilitation Science graduates is as follows:
| Race / Ethnicity | Graduates | Share |
|---|---|---|
| White | 556 | 50.2% |
| Asian | 61 | 5.5% |
| Hispanic or Latino | 260 | 23.5% |
| Black or African American | 50 | 4.5% |
| American Indian / Alaska Native | 6 | 0.5% |
| Two or More Races | 31 | 2.8% |
| Race Unknown | 22 | 2.0% |
| International Students | 121 | 10.9% |
See minority definition below.
How Much Do Rehabilitation Science Graduates Earn?
College Scorecard reports median earnings of Rehabilitation Science graduates 1, 4, and 5 years after completion. Earnings tend to climb steadily as graduates gain experience and move into mid-career roles.
| Years Out | Median Earnings |
|---|---|
| 1 year | $67,332 |
| 4 years | $70,102 |
| 5 years | $75,167 |
By year 5 out, median earnings rise to $75,167 — roughly 12% above the 1-year mark.
Source: U.S. Department of Education College Scorecard, field-of-study earnings tracker.
Online Rehabilitation Science Programs
Distance learning are documented by IPEDS for Rehabilitation Science. The table below shows how many graduates earned at least some of their coursework online (Distance-Ed Available) versus completing the entire program online (Distance-Ed Only).
| Award Level | Distance-Ed Available | Distance-Ed Only |
|---|---|---|
| Bachelor’s | 2 | 2 |
| Master’s | 1 | 2 |
| Doctoral (Research) | 1 | 2 |
Distance-Ed Only = degrees completed entirely online; Distance-Ed Available = degrees including at least some online coursework. Source: IPEDS Completions by Distance Education status.
Is a Degree in Rehabilitation Science Worth It?
On the earnings side, the federal earnings tracker, Rehabilitation Science graduates earn a median of $70,102 four years after completion — roughly 84% above the national median for workers with only a high school diploma (~$38,000).
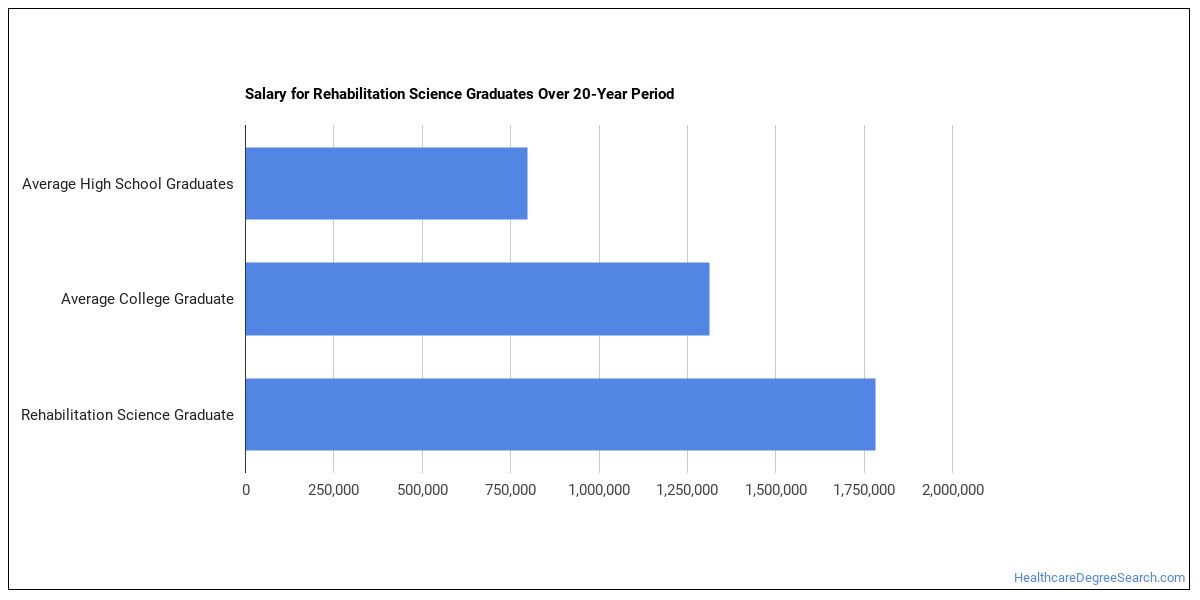
ROI estimate compares the program’s 4-yr median earnings against the 2023 BLS CPS median earnings for high-school-only workers. Source: U.S. Department of Education College Scorecard + BLS Current Population Survey.
Related Programs
You may also be interested in these closely related fields of study:
Explore Rehabilitation Science by State
Alabama
California
District of Columbia
Idaho
Kansas
Maryland
Mississippi
Nevada
New York
Oklahoma
South Carolina
Utah
West Virginia
Alaska
Colorado
Florida
Illinois
Kentucky
Massachusetts
Missouri
New Hampshire
North Carolina
Oregon
South Dakota
Vermont
Wisconsin
References
The racial-ethnic minorities count is calculated by taking the total number of students and subtracting white students and international students. This number is then divided by the total number of students to obtain the racial-ethnic minorities percentage.
- College Factual
- National Center for Education Statistics (IPEDS)
- O*NET Online
- U.S. Bureau of Labor Statistics
- U.S. Department of Education College Scorecard
More about our data sources and methodologies.
HealthcareDegreeSearch.com provides higher-education, college and university, degree, program, career, salary, and other helpful information to students, faculty, institutions, and other internet audiences. Presented information and data are subject to change. Inclusion on this website does not imply or represent a direct relationship with the company, school, or brand. Information, though believed correct at time of publication, may not be correct, and no warranty is provided. Contact the schools to verify any information before relying on it. Financial aid may be available for those who qualify. The displayed options may include sponsored or recommended results, not necessarily based on your preferences.
© HealthcareDegreeSearch.com – All Rights Reserved.