Speech-Language Pathologists in Virginia
Want to work in Virginia as a Speech-Language Pathologist? Read this first!
You’re in luck! Jobs for Speech-Language Pathologists in Virginia are projected to grow and these jobs tend to pay higher than average.
-
Projected employment for Speech-Language Pathologists in Virginia is growing faster than average.
-
Speech-Language Pathologists in Virginia earn higher salaries than the typical U.S. wage earner.
What Major Will Prepare You For a Speech-Language Pathologist Career?
- Health Professions
- Communication Sciences
- General Communication Sciences & Disorders
- Speech-Language Pathology/Pathologist
- Speech Pathology & Audiology
- Other Communication Disorders Sciences & Services
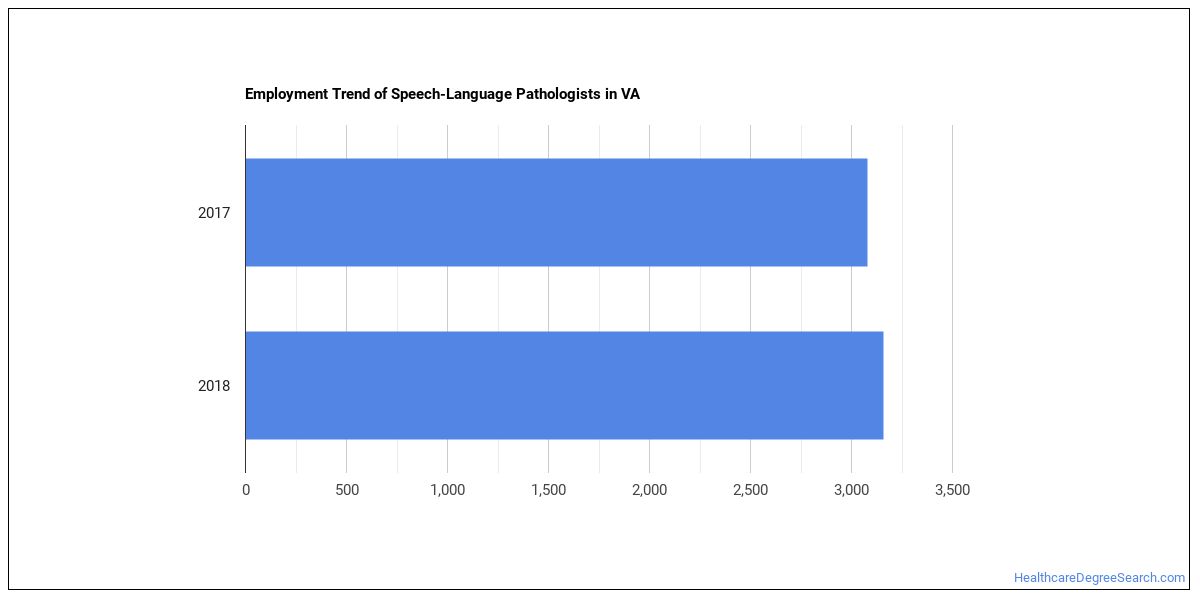
How Many Speech-Language Pathologists Work in Virginia?
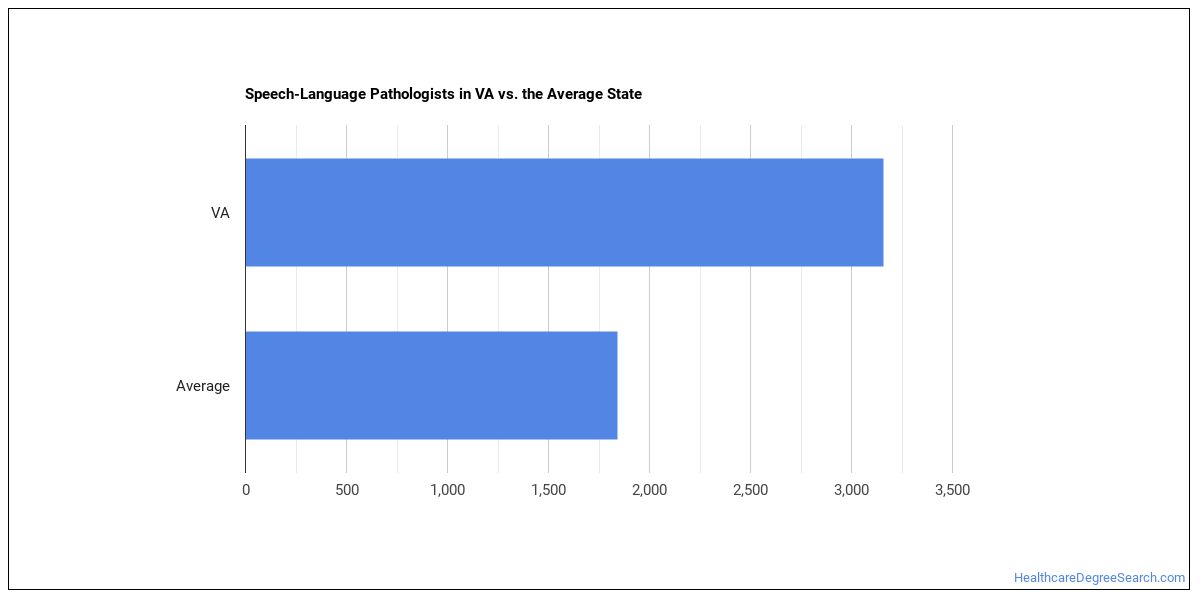
In 2018, there were 3,160 Speech-Language Pathologists working in the state.
There were 3,080 Speech-Language Pathologists employed in this state in 2017.
That’s growth of 80 jobs between 2017 and 2018.
The typical state has 1,840 Speech-Language Pathologists working in it, which means Virginia has more Speech-Language Pathologists than average.
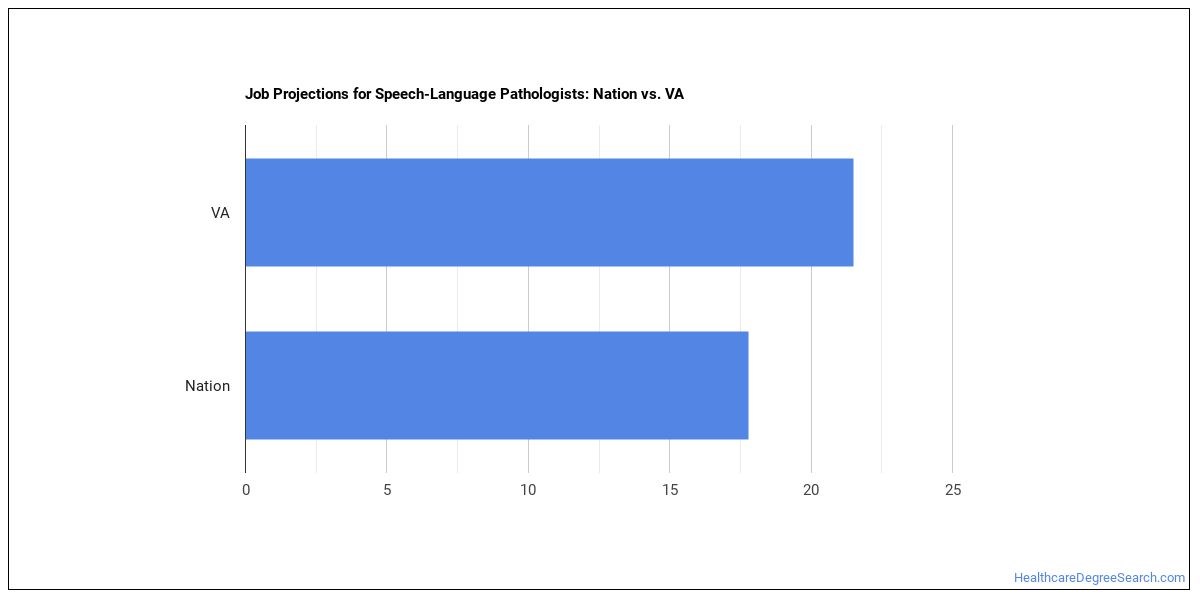
Job Projections for Virginia
Jobs for Speech-Language Pathologists in this state are growing at a rate of 21.5% which is faster than the nationwide estimated projection of 17.8%.
Virginia Annual Job Openings
The BLS estimates there will be 250 annual job openings, and 3,960 total jobs in 2026 for Speech-Language Pathologists in this state.
Nationwide, the prediction is 10,400 annual jobs and 171,000 total jobs in 2026.
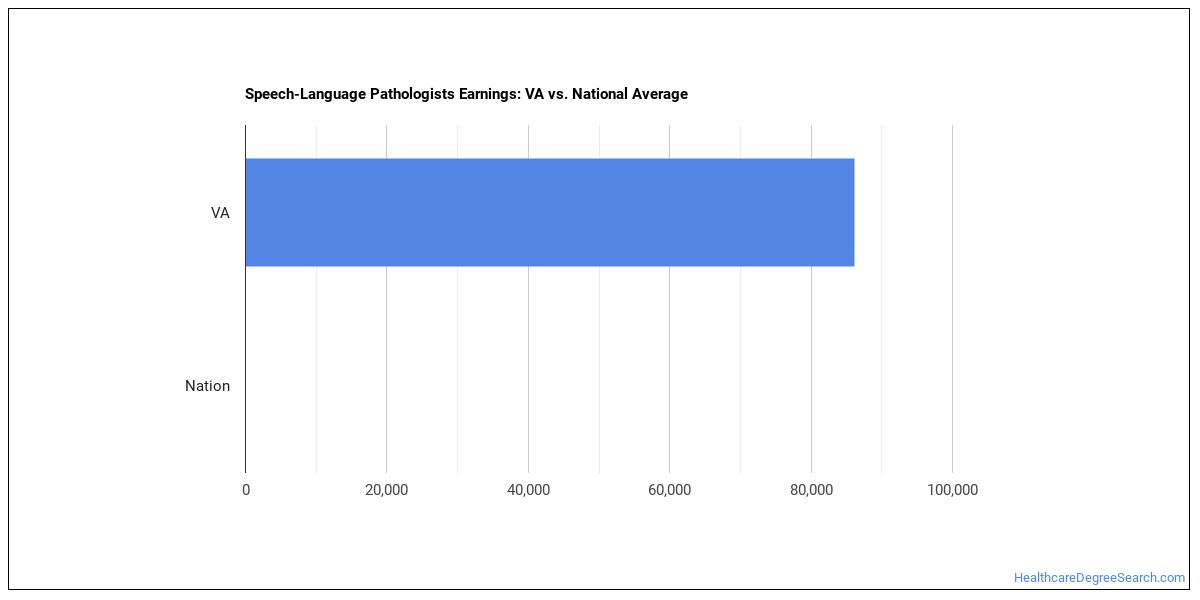
What do Speech-Language Pathologists Make in Virginia?
In 2018 wages for Speech-Language Pathologists ranged from $53,610 to $122,270 with $86,180 being the median annual salary.
Broken down to an hourly rate, workers in this field made anywhere from $25.78 to $58.79. The median hourly rate was $41.43.
Workers in this field were paid a median of $40.56 an hour in 2017.
The hourly rate grew by $0.87.
The median salary in Virginia is higher than the nationwide median salary.
Explore Best Ranked Schools for You
Top Virginia Metros for Speech-Language Pathologists
The table below shows some of the metros in this state with the most Speech-Language Pathologists.
| Metro | Number Employed | Annual Median Salary |
|---|---|---|
| Washington-Arlington-Alexandria, DC-VA-MD-WV | 2,430 | $92,620 |
| Richmond, VA | 630 | $79,780 |
| Virginia Beach-Norfolk-Newport News, VA-NC | 540 | $80,020 |
| Roanoke, VA | 190 | $78,150 |
| Kingsport-Bristol-Bristol, TN-VA | 110 | $83,590 |
| Charlottesville, VA | 100 | $76,310 |
| Lynchburg, VA | 100 | $93,520 |
| Harrisonburg, VA | 70 | $85,010 |
| Blacksburg-Christiansburg-Radford, VA | 60 | $86,100 |
| Winchester, VA-WV | 60 | $87,550 |
| Staunton-Waynesboro, VA | 30 | $74,620 |
Top States for Speech-Language Pathologists Employment
The table below shows the states where most Speech-Language Pathologists work.
| State | Number Employed | Annual Median Salary |
|---|---|---|
| Texas | 14,330 | $71,940 |
| California | 13,220 | $92,750 |
| New York | 12,750 | $82,170 |
| Florida | 7,380 | $76,820 |
| Illinois | 6,820 | $74,930 |
| New Jersey | 6,340 | $87,500 |
| Ohio | 5,470 | $74,390 |
| Pennsylvania | 5,450 | $74,660 |
| North Carolina | 4,430 | $73,250 |
| Massachusetts | 4,060 | $85,870 |
| Michigan | 3,950 | $74,460 |
| Colorado | 3,540 | $87,080 |
| Missouri | 3,400 | $77,670 |
| Georgia | 3,300 | $75,900 |
| Washington | 3,250 | $73,250 |
| Minnesota | 3,190 | $73,880 |
| Virginia | 3,160 | $86,180 |
| Tennessee | 2,990 | $79,790 |
| Maryland | 2,900 | $86,610 |
| Indiana | 2,480 | $74,240 |
Below are the states where Speech-Language Pathologists get paid the most:
| State | Annual Median Salary |
|---|---|
| District of Columbia | $94,330 |
| California | $92,750 |
| Connecticut | $91,530 |
| New Jersey | $87,500 |
| Colorado | $87,080 |
| Maryland | $86,610 |
| Virginia | $86,180 |
| Massachusetts | $85,870 |
| Alaska | $85,200 |
| Oregon | $84,790 |
Related Careers in Virginia
Discover similar careers:
| Occupation | Virginia Employment Total |
|---|---|
| Physical Therapists | 6,470 |
| Occupational Therapists | 3,070 |
| Respiratory Therapists | 2,550 |
| Radiation Therapists | 600 |
| Recreational Therapists | 420 |
| Exercise Physiologists | 360 |
References
- Bureau of Labor Statistics (BLS)
- College Factual
- National Center for Education Statistics
- O*NET Online
- Image Credit: By Ghozt Tramp under License
More about our data sources and methodologies.
HealthcareDegreeSearch.com provides higher-education, college and university, degree, program, career, salary, and other helpful information to students, faculty, institutions, and other internet audiences. Presented information and data are subject to change. Inclusion on this website does not imply or represent a direct relationship with the company, school, or brand. Information, though believed correct at time of publication, may not be correct, and no warranty is provided. Contact the schools to verify any information before relying on it. Financial aid may be available for those who qualify. The displayed options may include sponsored or recommended results, not necessarily based on your preferences.
© HealthcareDegreeSearch.com – All Rights Reserved.