Mental & Social Health Services at Lackawanna College
If you are interested in studying Mental & Social Health Services, consider the program at Lackawanna College. We’ve gathered the following information to help you decide.
Lackawanna College is in Scranton, PA.
In the most recent year for which we have data, 74 mental & social health services graduations were recorded at Lackawanna College.
Featured schools near , edit
Online Class Availability at Lackawanna College
Distance learning is available at Lackawanna College. Among 2,211 students, 646 (29%) were enrolled entirely in distance education and 887 (40%) took at least some classes online.
Mental & Social Health Services Rankings at Lackawanna College
Rankings can help you compare Lackawanna College’s Mental & Social Health Services program against peer institutions.
Bachelor’s-Level Rankings
| Ranking | Scope | Rank |
|---|---|---|
| Best Value | Pennsylvania | #17 of 28 |
| Best Schools (Quality) | Pennsylvania | #26 of 28 |
| Best Value | Middle Atlantic (Region) | #68 of 95 |
| Best Schools (Quality) | Middle Atlantic (Region) | #94 of 96 |
| Best Value | Nationwide | #418 of 514 |
| Best Schools (Quality) | Nationwide | #480 of 530 |
Associate-Level Rankings
| Ranking | Scope | Rank |
|---|---|---|
| Best Value | Pennsylvania | #17 of 28 |
| Best Schools (Quality) | Pennsylvania | #26 of 28 |
| Best Value | Middle Atlantic (Region) | #68 of 95 |
| Best Schools (Quality) | Middle Atlantic (Region) | #94 of 96 |
| Best Value | Nationwide | #418 of 514 |
| Best Schools (Quality) | Nationwide | #480 of 530 |
Earnings for Mental & Social Health Services Graduates from Lackawanna College
Graduates of Lackawanna College’s Mental & Social Health Services program earn at the following median levels (per the U.S. Department of Education’s College Scorecard):

| Years After Graduation | Median Earnings |
|---|---|
| 2 years | $17,437 |
| 3 years | $21,893 |
| 4 years | $25,817 |
| 5 years | $31,111 |
Is this above or below average for the school? At the four-year mark, Mental & Social Health Services graduates from Lackawanna College earn a median of $25,817, compared with $36,087 for all Lackawanna College graduates — about 28% lower than the school-wide median.

Median Debt at Graduation
Median student loan debt for Mental & Social Health Services graduates from Lackawanna College is $33,010.
Student Demographics & Diversity
The following sections describe the diversity of Mental & Social Health Services graduates at Lackawanna College, broken down by degree level.
Across all degree levels, Mental & Social Health Services graduates at Lackawanna College are 68% women (50) and 32% men (24).
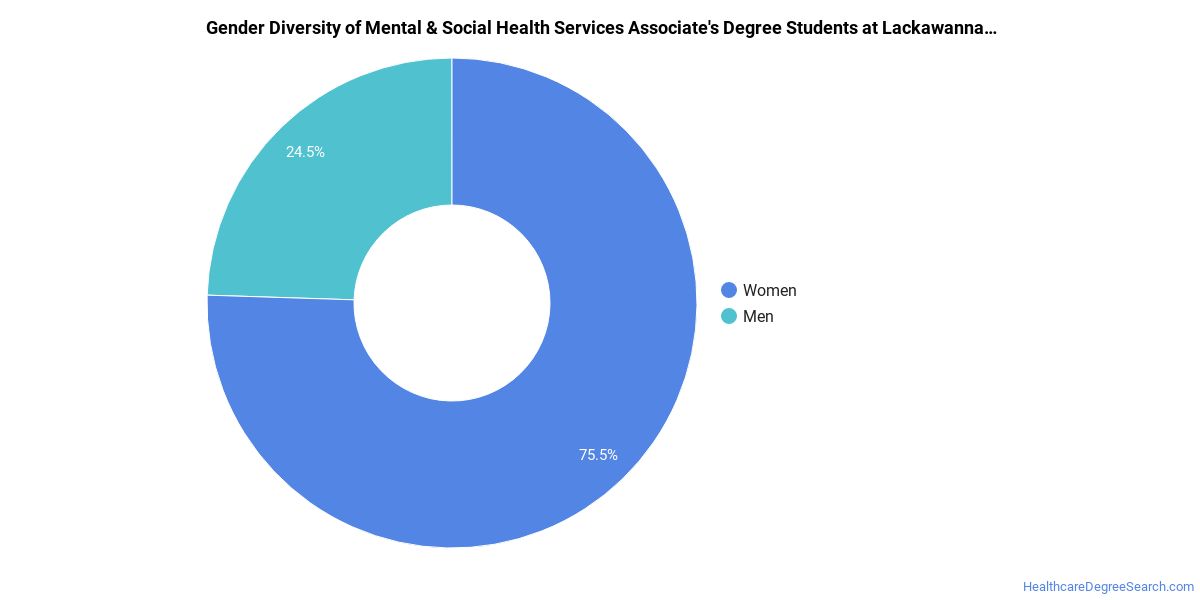
Mental & Social Health Services Associate’s Program at Lackawanna College
Among the 49 associate’s mental & social health services graduates at Lackawanna College, 92% were women (45) and 8% were men (4).
The following table and chart show the race/ethnicity of Mental & Social Health Services associate’s degree recipients at Lackawanna College.
| Race / Ethnicity | Number of Graduates |
|---|---|
| White | 30 |
| Hispanic / Latino | 7 |
| Two or More Races | 2 |
| International (Nonresident) | 1 |
| Unknown | 9 |
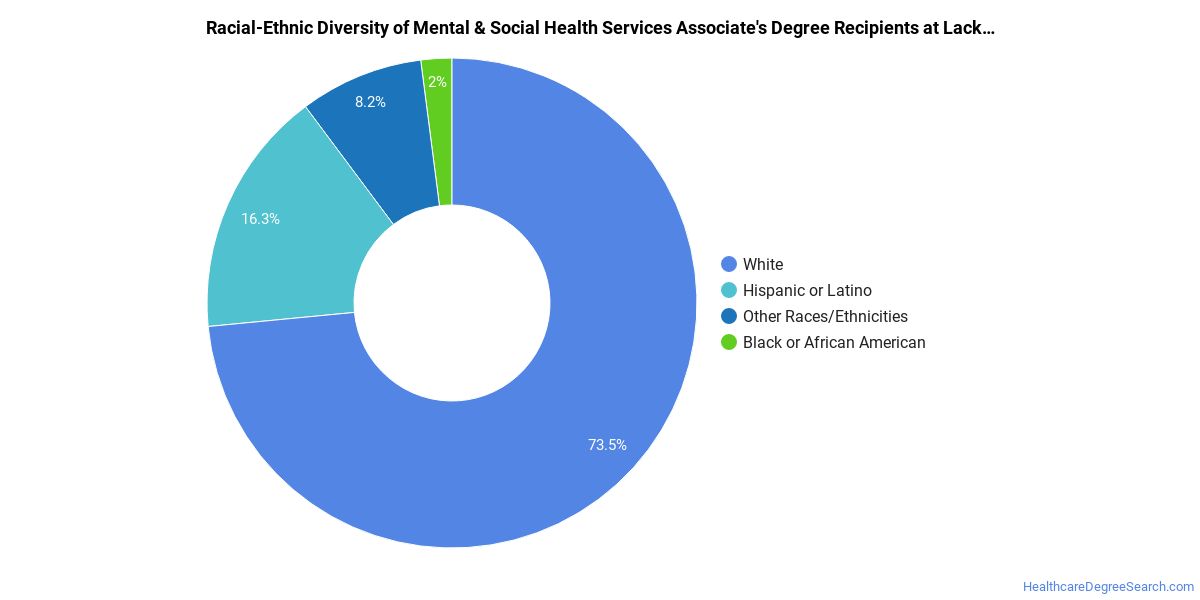
Racial-ethnic minorities make up 18% of Mental & Social Health Services associate’s degree recipients at Lackawanna College, below the national average of 48%.*
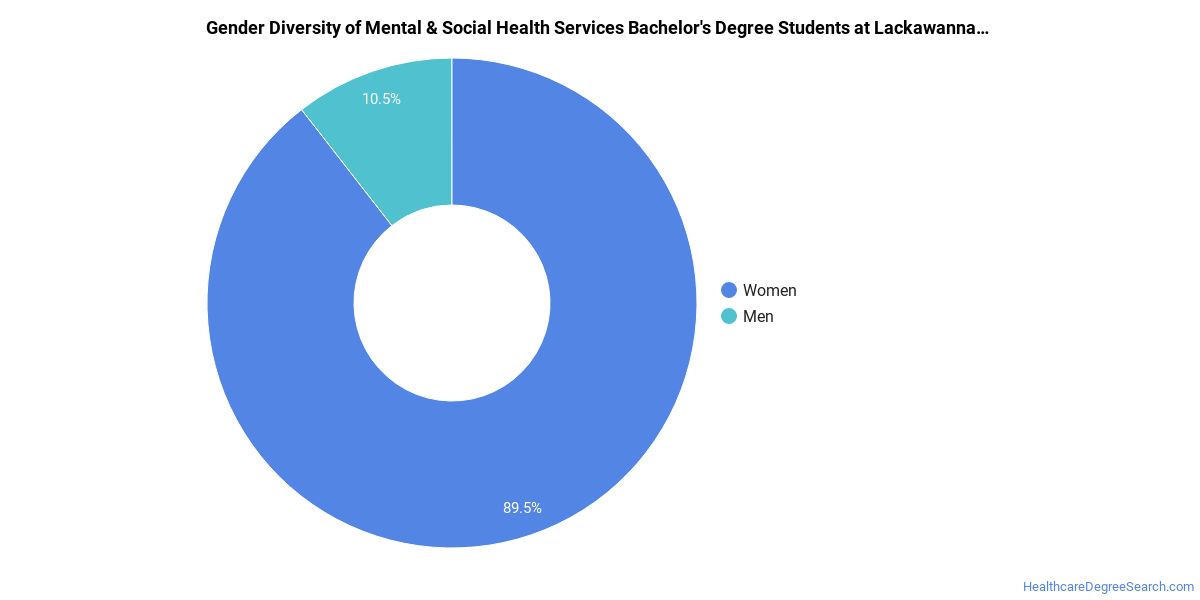
Mental & Social Health Services Bachelor’s Program at Lackawanna College
Of the 25 bachelor’s mental & social health services graduates at Lackawanna College, 20% were women (5) and 80% were men (20).
The following table and chart show the race/ethnicity of Mental & Social Health Services bachelor’s degree recipients at Lackawanna College.
| Race / Ethnicity | Number of Graduates |
|---|---|
| White | 15 |
| Hispanic / Latino | 2 |
| Black / African American | 2 |
| Two or More Races | 1 |
| Unknown | 5 |
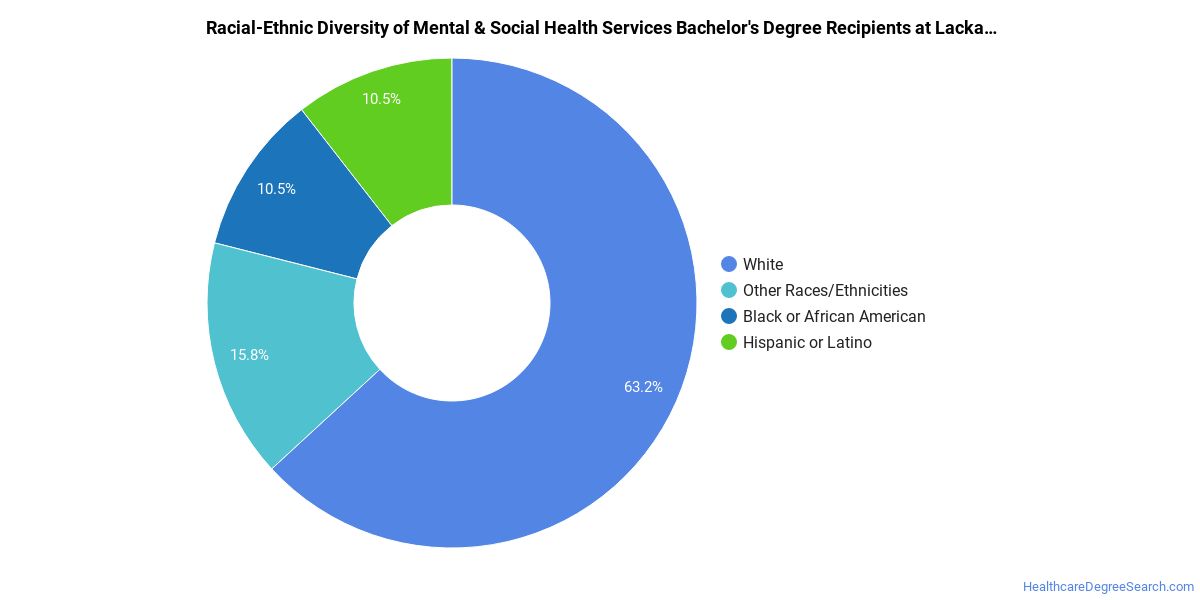
Racial-ethnic minorities make up 20% of Mental & Social Health Services bachelor’s degree recipients at Lackawanna College, below the national average of 41%.*
*The racial-ethnic minorities figure is the total number of graduates minus White, international (nonresident), and unknown-race graduates.
More Specific Mental & Social Health Services Concentrations at Lackawanna College
This Mental & Social Health Services program at Lackawanna College breaks down into more specific concentrations:
| Concentration | Graduates |
|---|---|
| Other Mental Health Services | 74 |
Best-Paid Careers for Mental & Social Health Services Graduates
Those who complete Mental & Social Health Services program at Lackawanna College go on to a range of careers. Below are the top-paying careers for Mental & Social Health Services majors, ordered by median annual salary:
| Occupation | Nationwide Median Wage |
|---|---|
| Psychology Teachers, Postsecondary | $98,479 |
| Counselors, All Other | $81,766 |
| Health Education Specialists | $81,726 |
| Healthcare Social Workers | $78,044 |
| Marriage and Family Therapists | $74,325 |
| Community Health Workers | $73,901 |
| Mental Health Counselors | $72,983 |
| Social Work Teachers, Postsecondary | $65,510 |
| Genetic Counselors | $58,726 |
| Mental Health and Substance Abuse Social Workers | $58,560 |
References
- IPEDS — Integrated Postsecondary Education Data System
- U.S. Department of Education — College Scorecard
- O*NET Online (Bureau of Labor Statistics)
- National Center for Education Statistics
More about our data sources and methodologies.
HealthcareDegreeSearch.com provides higher-education, college and university, degree, program, career, salary, and other helpful information to students, faculty, institutions, and other internet audiences. Presented information and data are subject to change. Inclusion on this website does not imply or represent a direct relationship with the company, school, or brand. Information, though believed correct at time of publication, may not be correct, and no warranty is provided. Contact the schools to verify any information before relying on it. Financial aid may be available for those who qualify. The displayed options may include sponsored or recommended results, not necessarily based on your preferences.
© HealthcareDegreeSearch.com – All Rights Reserved.