Public Health at University of Lynchburg
What traits are you looking for in a school for Public Health, you may want to check out the program at University of Lynchburg. Get started with the following essential facts.
University of Lynchburg is in Lynchburg, VA.
For the most recent IPEDS reporting year, 32 public health degrees were awarded at University of Lynchburg.
Featured schools near , edit
Studying Online at University of Lynchburg
Many students take online classes at University of Lynchburg. Of 2,316 students, 441 (19%) studied exclusively online and 498 (22%) took at least some classes online.
Public Health Rankings at University of Lynchburg
Use these rankings to compare University of Lynchburg’s Public Health program to other colleges that offer this major.
Bachelor’s-Level Rankings
| Ranking | Scope | Rank |
|---|---|---|
| Best Schools (Quality) | Virginia | #6 of 11 |
| Best Value | Virginia | #6 of 11 |
| Best Schools (Quality) | Southeast (Region) | #43 of 106 |
| Best Value | Southeast (Region) | #70 of 103 |
| Best Schools (Quality) | Nationwide | #243 of 430 |
| Best Value | Nationwide | #270 of 411 |
Master’s-Level Rankings
| Ranking | Scope | Rank |
|---|---|---|
| Best Schools (Quality) | Virginia | #6 of 11 |
| Best Value | Virginia | #6 of 11 |
| Best Schools (Quality) | Southeast (Region) | #43 of 106 |
| Best Value | Southeast (Region) | #70 of 103 |
| Best Schools (Quality) | Nationwide | #243 of 430 |
| Best Value | Nationwide | #270 of 411 |
Earnings for Public Health Graduates from University of Lynchburg
Graduates of University of Lynchburg’s Public Health program earn at the following median levels (per the U.S. Department of Education’s College Scorecard):
| Years After Graduation | Median Earnings |
|---|---|
| 1 year | $36,681 |
Student Demographics & Diversity
The following sections describe the diversity of Public Health graduates at University of Lynchburg, by degree type.
Across all degree levels, Public Health graduates at University of Lynchburg are 94% women (30) and 6% men (2).
Public Health Bachelor’s Program at University of Lynchburg
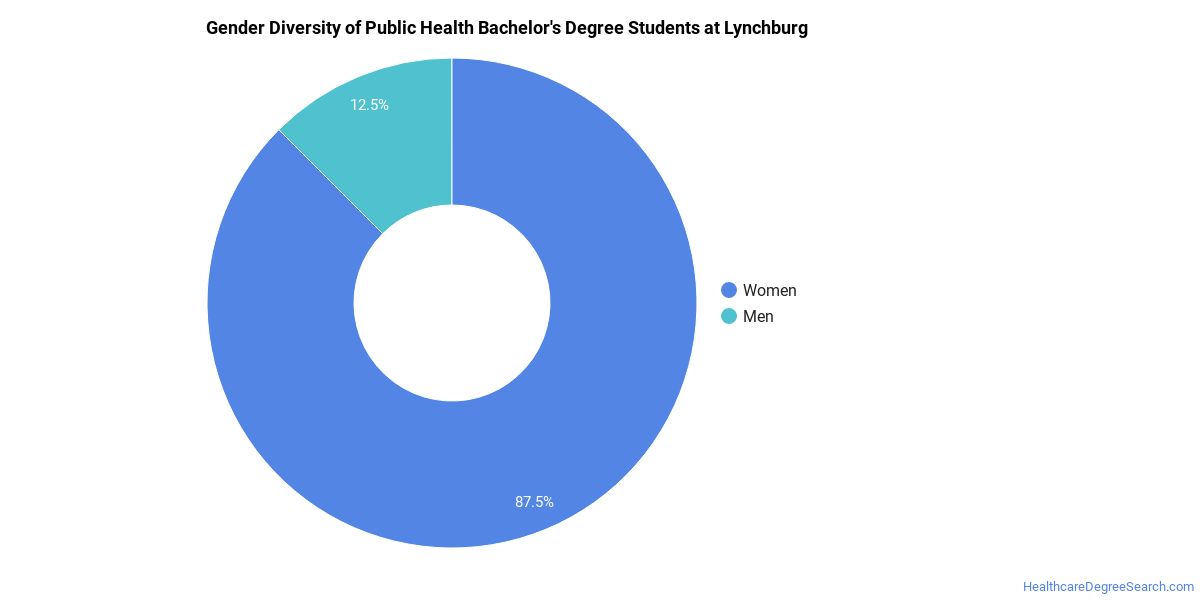
Of the 19 bachelor’s public health degrees awarded at University of Lynchburg, 95% were women (18) and 5% were men (1).
The following table and chart show the race/ethnicity of Public Health bachelor’s degree recipients at University of Lynchburg.
| Race / Ethnicity | Number of Graduates |
|---|---|
| White | 14 |
| Hispanic / Latino | 3 |
| Black / African American | 1 |
| American Indian / Alaska Native | 1 |
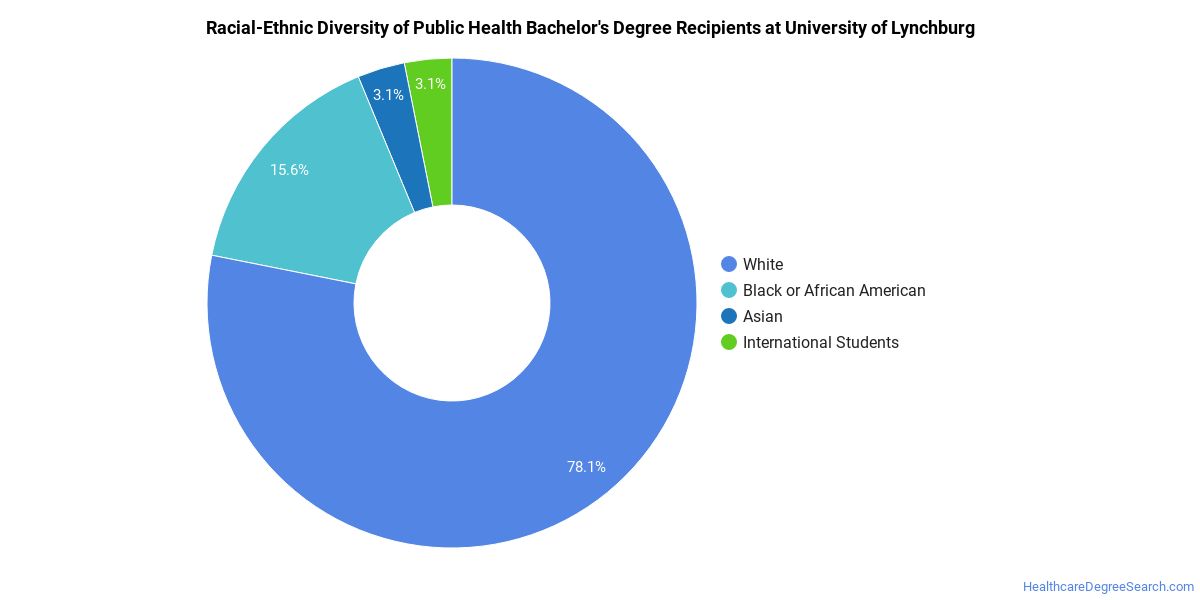
Minority students account for 26% of Public Health bachelor’s degree recipients at University of Lynchburg, lower than the national average of 57%.*
Public Health Master’s Program at University of Lynchburg
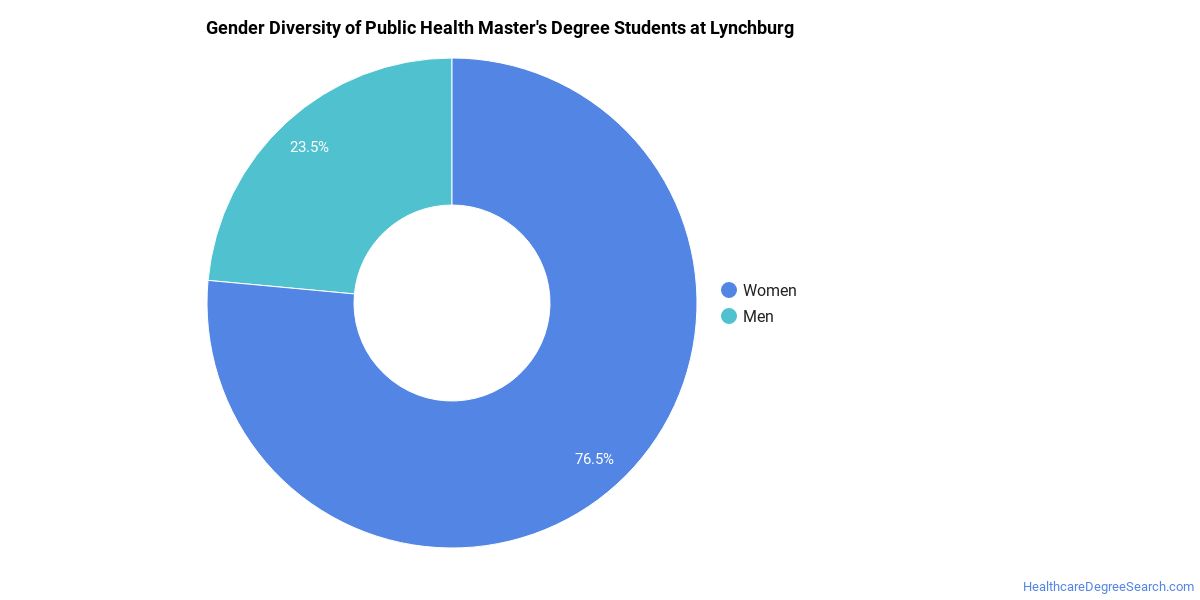
Of the 12 master’s public health graduates at University of Lynchburg, 92% were women (11) and 8% were men (1).
The following table and chart show the race/ethnicity of Public Health master’s degree recipients at University of Lynchburg.
| Race / Ethnicity | Number of Graduates |
|---|---|
| White | 9 |
| Hispanic / Latino | 2 |
| International (Nonresident) | 1 |
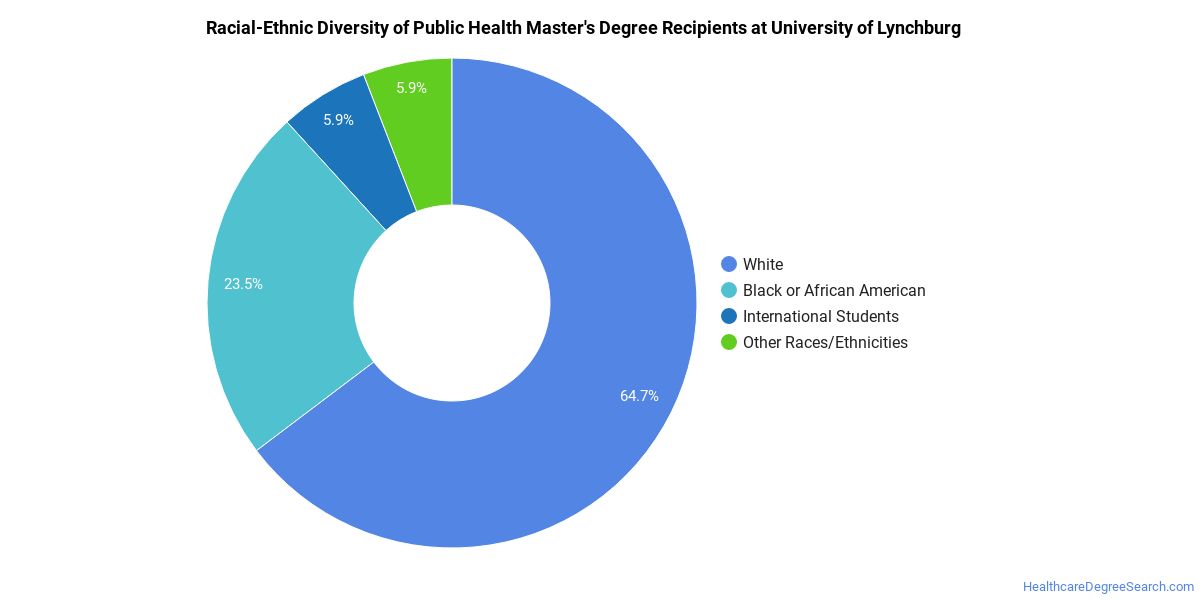
Minority students account for 17% of Public Health master’s degree recipients at University of Lynchburg, below the national average of 47%.*
*The racial-ethnic minorities figure is the total number of graduates minus White, international (nonresident), and unknown-race graduates.
More Specific Public Health Concentrations at University of Lynchburg
The Public Health program at University of Lynchburg offers more specialized concentrations:
| Concentration | Graduates |
|---|---|
| General Public Health | 12 |
| Public Health Education & Promotion | 19 |
| International Public Health | 1 |
Best-Paid Careers for Public Health Graduates
Graduates of the Public Health program at University of Lynchburg work across a variety of fields. The table below ranks the best-paid careers for Public Health majors, ordered by median annual salary:
| Occupation | Nationwide Median Wage |
|---|---|
| Medical and Health Services Managers | $129,557 |
| Physicists | $111,776 |
| Medical Scientists, Except Epidemiologists | $111,314 |
| Environmental Scientists and Specialists, Including Health | $90,139 |
| Epidemiologists | $87,636 |
| Industrial Ecologists | $83,212 |
| Health Education Specialists | $81,726 |
| Community Health Workers | $73,901 |
| Environmental Restoration Planners | $61,737 |
| Genetic Counselors | $58,726 |
References
- IPEDS — Integrated Postsecondary Education Data System
- U.S. Department of Education — College Scorecard
- O*NET Online (Bureau of Labor Statistics)
- National Center for Education Statistics
More about our data sources and methodologies.
HealthcareDegreeSearch.com provides higher-education, college and university, degree, program, career, salary, and other helpful information to students, faculty, institutions, and other internet audiences. Presented information and data are subject to change. Inclusion on this website does not imply or represent a direct relationship with the company, school, or brand. Information, though believed correct at time of publication, may not be correct, and no warranty is provided. Contact the schools to verify any information before relying on it. Financial aid may be available for those who qualify. The displayed options may include sponsored or recommended results, not necessarily based on your preferences.
© HealthcareDegreeSearch.com – All Rights Reserved.