Pharmacy/Pharmaceutical Sciences at University of California-Irvine
If you plan to study Pharmacy/Pharmaceutical Sciences, consider the program at University of California-Irvine. We’ve gathered the following information to help you decide.
University of California-Irvine is in Irvine, CA.
During the most recent reporting year, 92 pharmacy/pharmaceutical sciences degrees were awarded at University of California-Irvine.
Featured schools near , edit
Studying Online at University of California-Irvine
Online coursework is an option at University of California-Irvine. Of 37,297 students, 614 (2%) studied exclusively online and 12,862 (34%) took at least some classes online.
Pharmacy/Pharmaceutical Sciences Rankings at University of California-Irvine
Rankings can help you compare University of California-Irvine’s Pharmacy/Pharmaceutical Sciences program against other schools offering the same major.
Bachelor’s-Level Rankings
| Ranking | Scope | Rank |
|---|---|---|
| Best Value | California | #2 of 6 |
| Best Value | Far Western (Region) | #3 of 11 |
| Best Schools (Quality) | California | #5 of 9 |
| Best Value | Nationwide | #9 of 121 |
| Best Schools (Quality) | Far Western (Region) | #10 of 15 |
| Best Schools (Quality) | Nationwide | #57 of 134 |
Master’s-Level Rankings
| Ranking | Scope | Rank |
|---|---|---|
| Best Value | California | #2 of 6 |
| Best Value | Far Western (Region) | #3 of 11 |
| Best Schools (Quality) | California | #5 of 9 |
| Best Value | Nationwide | #9 of 121 |
| Best Schools (Quality) | Far Western (Region) | #10 of 15 |
| Best Schools (Quality) | Nationwide | #57 of 134 |
Doctoral-Level Rankings
| Ranking | Scope | Rank |
|---|---|---|
| Best Value | California | #2 of 6 |
| Best Value | Far Western (Region) | #3 of 11 |
| Best Schools (Quality) | California | #5 of 9 |
| Best Value | Nationwide | #9 of 121 |
| Best Schools (Quality) | Far Western (Region) | #10 of 15 |
| Best Schools (Quality) | Nationwide | #57 of 134 |
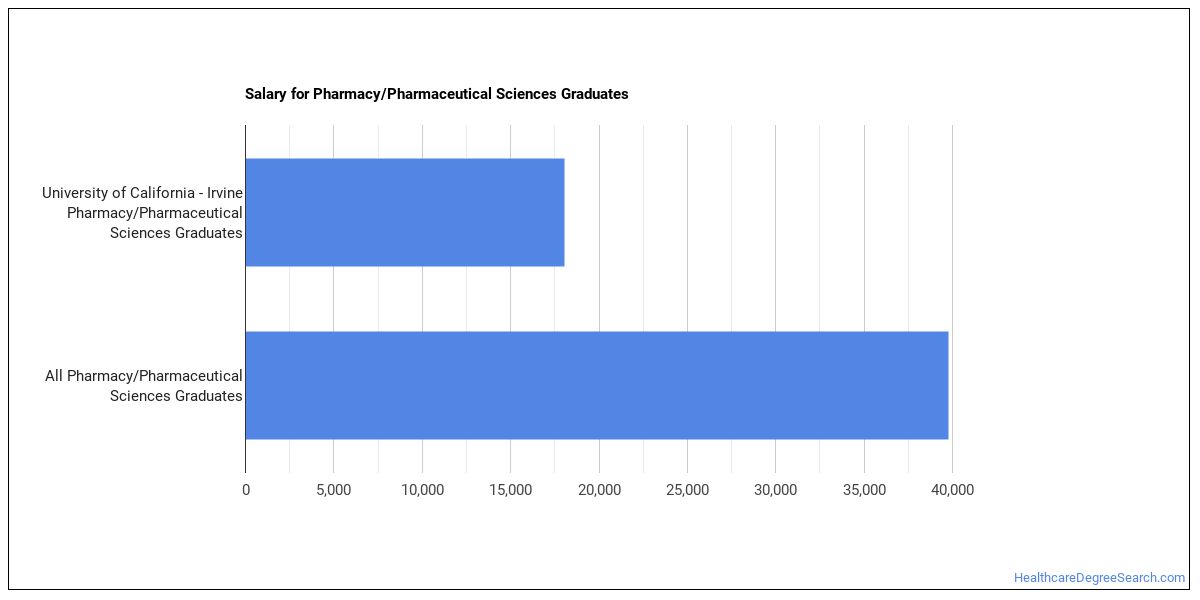
Earnings for Pharmacy/Pharmaceutical Sciences Graduates from University of California-Irvine
Students who complete University of California-Irvine’s Pharmacy/Pharmaceutical Sciences program earn the following amounts (per the U.S. Department of Education’s College Scorecard):
| Years After Graduation | Median Earnings |
|---|---|
| 1 year | $18,068 |
| 2 years | $17,139 |
| 3 years | $30,738 |
| 4 years | $50,557 |
| 5 years | $92,028 |
How do these earnings stack up against the rest of the school? Four years out, Pharmacy/Pharmaceutical Sciences graduates from University of California-Irvine take home a median $50,557, compared with $71,034 for all University of California-Irvine graduates — about 29% lower than the school-wide median.

Median Debt at Graduation
Typical debt at graduation for Pharmacy/Pharmaceutical Sciences graduates from University of California-Irvine is $15,026.
Student Demographics & Diversity
Take a look at the diversity of Pharmacy/Pharmaceutical Sciences graduates at University of California-Irvine, broken down by degree level.
Looking at the program as a whole, Pharmacy/Pharmaceutical Sciences graduates at University of California-Irvine are 55% women (51) and 45% men (41).
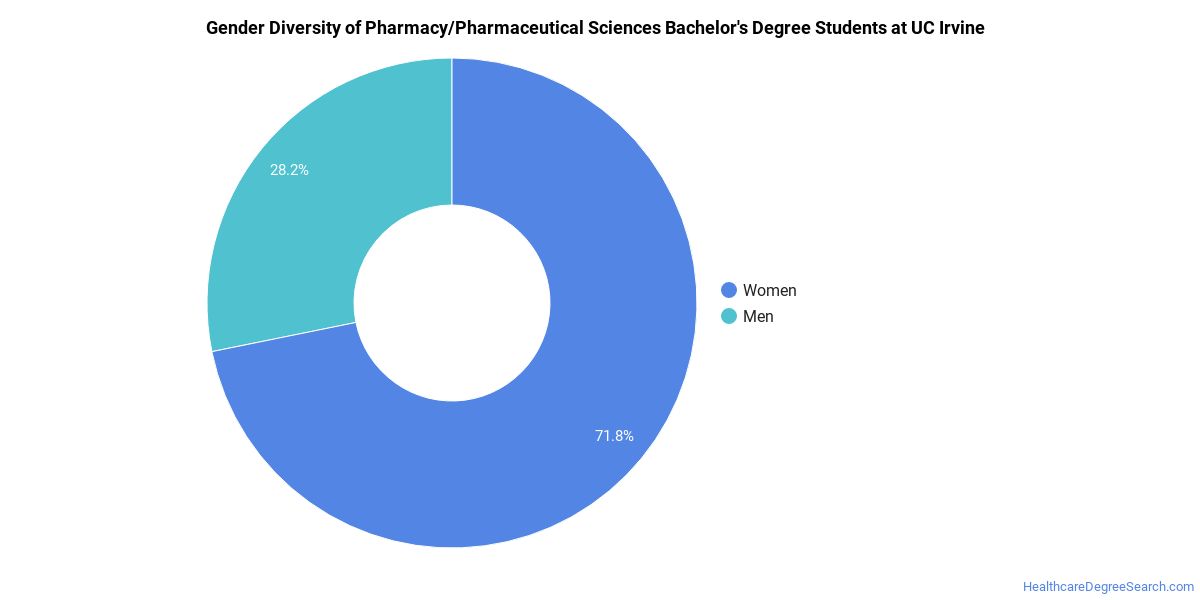
Pharmacy/Pharmaceutical Sciences Bachelor’s Program at University of California-Irvine
Of the 82 bachelor’s pharmacy/pharmaceutical sciences degrees awarded at University of California-Irvine, 55% were women (45) and 45% were men (37).
The following table and chart show the race/ethnicity of Pharmacy/Pharmaceutical Sciences bachelor’s degree recipients at University of California-Irvine.
| Race / Ethnicity | Number of Graduates |
|---|---|
| White | 9 |
| Hispanic / Latino | 9 |
| Black / African American | 2 |
| Asian | 55 |
| Two or More Races | 2 |
| International (Nonresident) | 4 |
| Unknown | 1 |
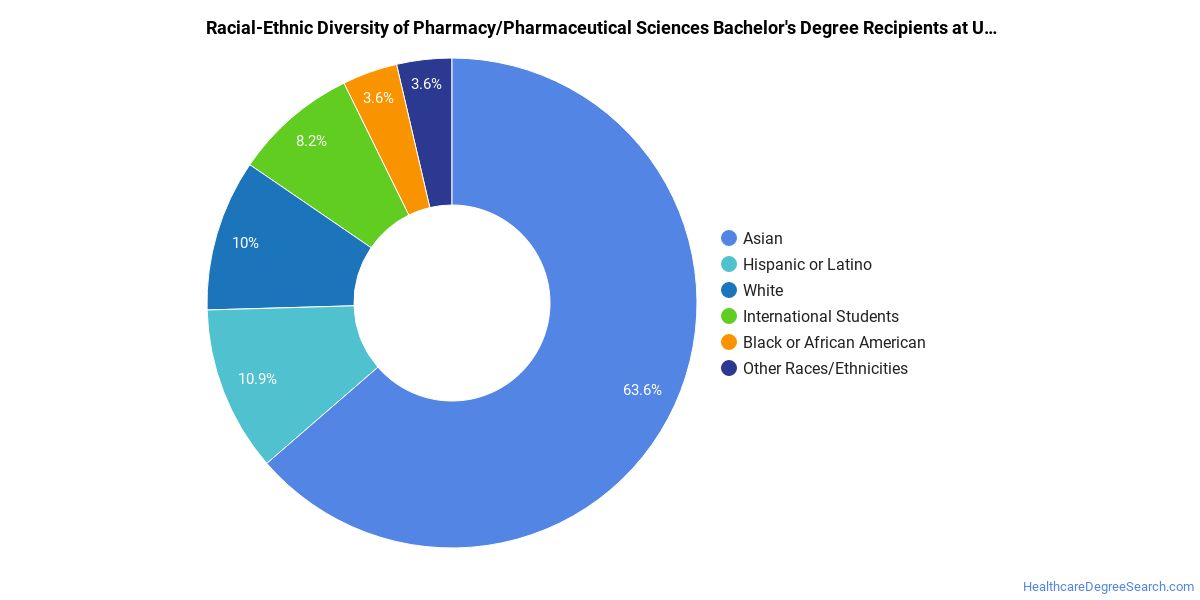
Racial-ethnic minorities make up 83% of Pharmacy/Pharmaceutical Sciences bachelor’s degree recipients at University of California-Irvine, above the national average of 40%.*
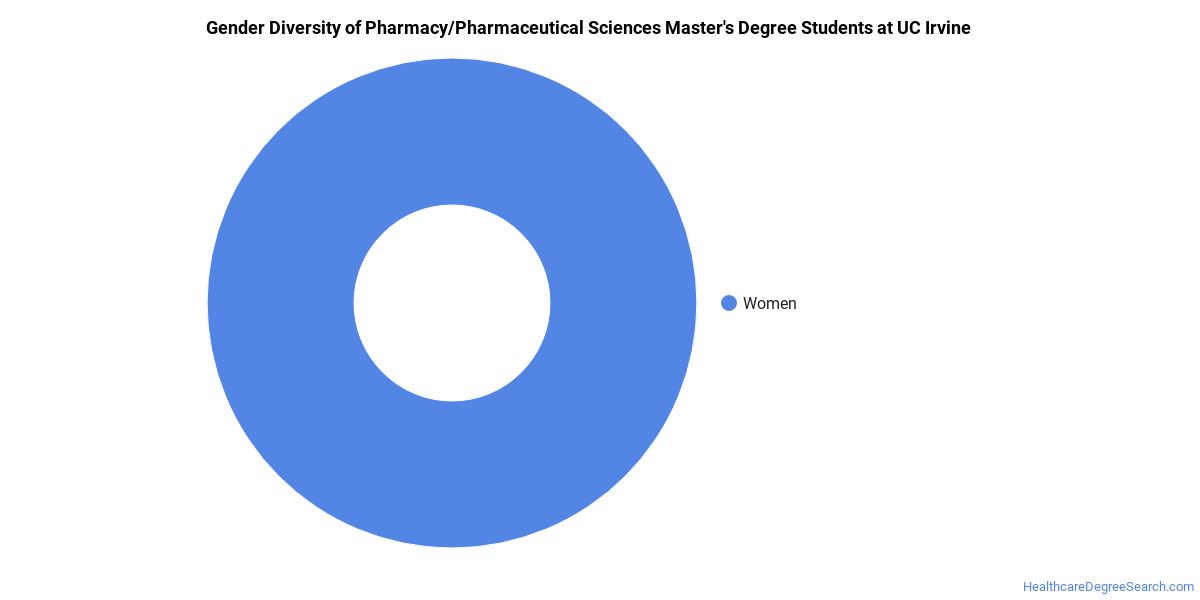
Pharmacy/Pharmaceutical Sciences Master’s Program at University of California-Irvine
Among the 3 master’s pharmacy/pharmaceutical sciences degrees awarded at University of California-Irvine, 67% were women (2) and 33% were men (1).
The following table and chart show the race/ethnicity of Pharmacy/Pharmaceutical Sciences master’s degree recipients at University of California-Irvine.
| Race / Ethnicity | Number of Graduates |
|---|---|
| White | 2 |
| Hispanic / Latino | 1 |

Racial-ethnic minorities make up 33% of Pharmacy/Pharmaceutical Sciences master’s degree recipients at University of California-Irvine, above the national average of 23%.*
Pharmacy/Pharmaceutical Sciences Doctoral Program at University of California-Irvine
Of the 7 doctoral pharmacy/pharmaceutical sciences graduates at University of California-Irvine, 57% were women (4) and 43% were men (3).

The following table and chart show the race/ethnicity of Pharmacy/Pharmaceutical Sciences doctoral degree recipients at University of California-Irvine.
| Race / Ethnicity | Number of Graduates |
|---|---|
| White | 4 |
| Hispanic / Latino | 1 |
| Asian | 1 |
| Unknown | 1 |

Minority students account for 29% of Pharmacy/Pharmaceutical Sciences doctoral degree recipients at University of California-Irvine, higher than the national average of 24%.*
*The racial-ethnic minorities figure is the total number of graduates minus White, international (nonresident), and unknown-race graduates.
More Specific Pharmacy/Pharmaceutical Sciences Concentrations at University of California-Irvine
The Pharmacy/Pharmaceutical Sciences program at University of California-Irvine includes the following sub-specializations:
| Concentration | Graduates |
|---|---|
| Pharmaceutical Sciences | 92 |
| Pharmacy. | — |
Best-Paid Careers for Pharmacy/Pharmaceutical Sciences Graduates
Graduates of the Pharmacy/Pharmaceutical Sciences program at University of California-Irvine go on to a range of careers. Here are the best-paid careers for Pharmacy/Pharmaceutical Sciences graduates, ordered by median annual salary:
| Occupation | Nationwide Median Wage |
|---|---|
| Water Resource Specialists | $179,716 |
| Wind Energy Development Managers | $169,952 |
| Loss Prevention Managers | $165,723 |
| Natural Sciences Managers | $132,227 |
| Medical and Health Services Managers | $129,557 |
| Wind Energy Operations Managers | $122,567 |
| Compliance Managers | $117,178 |
| Medical Scientists, Except Epidemiologists | $111,314 |
| Clinical Research Coordinators | $110,931 |
| Brownfield Redevelopment Specialists and Site Managers | $99,321 |
References
- IPEDS — Integrated Postsecondary Education Data System
- U.S. Department of Education — College Scorecard
- O*NET Online (Bureau of Labor Statistics)
- National Center for Education Statistics
More about our data sources and methodologies.
HealthcareDegreeSearch.com provides higher-education, college and university, degree, program, career, salary, and other helpful information to students, faculty, institutions, and other internet audiences. Presented information and data are subject to change. Inclusion on this website does not imply or represent a direct relationship with the company, school, or brand. Information, though believed correct at time of publication, may not be correct, and no warranty is provided. Contact the schools to verify any information before relying on it. Financial aid may be available for those who qualify. The displayed options may include sponsored or recommended results, not necessarily based on your preferences.
© HealthcareDegreeSearch.com – All Rights Reserved.