Other Rehabilitation and Therapeutic Professions
Types of Degrees Other Rehabilitation and Therapeutic Professions Majors Are Getting
The following table lists how many other rehabilitation and therapeutic professions graduations there were for each degree level during the last year for which data was available.
| Education Level | Number of Grads |
|---|---|
| Bachelor’s Degree | 342 |
| Master’s Degree | 193 |
| Graduate Certificate | 58 |
| Associate Degree | 51 |
| Doctor’s Degree | 26 |
What Can You Do With a Other Rehabilitation and Therapeutic Professions Major?
Below is a list of occupations associated with other rehabilitation and therapeutic professions:
| Job Title | Job Growth Rate | Median Salary |
|---|---|---|
| Therapists | 19.9% | $50,980 |
Who Is Getting a Bachelor’s Degree in Other Rehabilitation and Therapeutic Professions?
Racial-Ethnic Diversity
At the countrywide level, the racial-ethnic distribution of other rehabilitation and therapeutic professions majors is as follows:
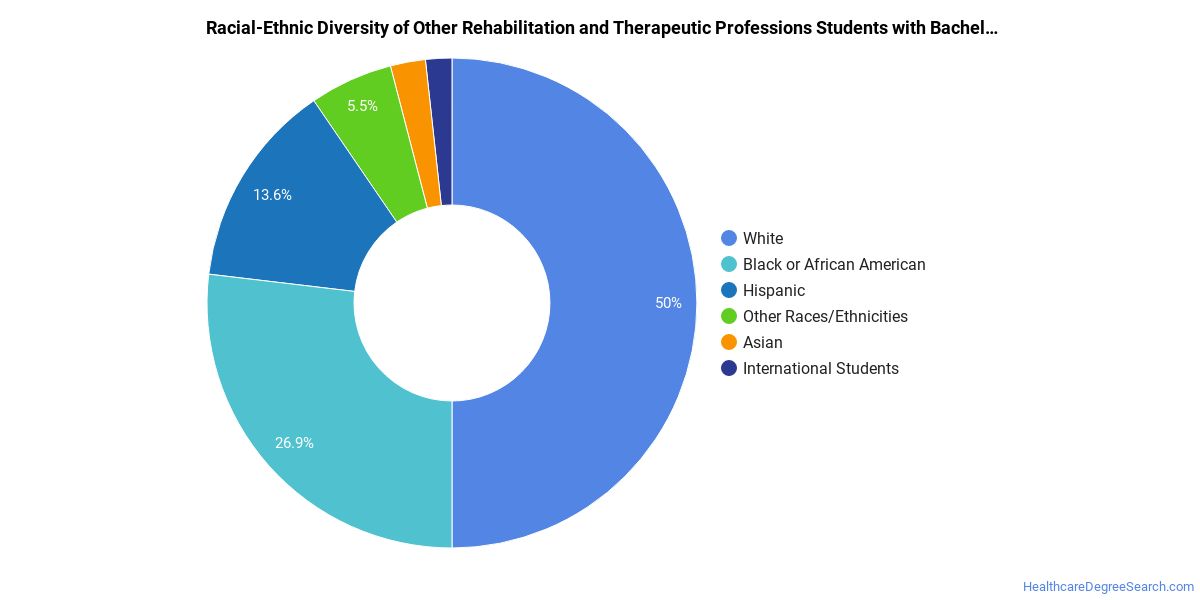
| Race/Ethnicity | Number of Grads |
|---|---|
| Asian | 12 |
| Black or African American | 88 |
| Hispanic or Latino | 82 |
| White | 130 |
| International Students | 4 |
| Other Races/Ethnicities | 26 |
Geographic Diversity
Other Rehabilitation and Therapeutic Professions appeals to people across the globe. About 1.2% of those with this major are international students.
Online Other Rehabilitation and Therapeutic Professions Programs
The following table lists the number of programs by degree level, along with how many schools offered online courses in the field.
| Degree Level | Colleges Offering Programs | Colleges Offering Online Classes |
|---|---|---|
| Certificate (Less Than 1 Year) | 0 | 0 |
| Certificate (1-2 years) | 3 | 0 |
| Certificate (2-4 Years) | 1 | 0 |
| Associate’s Degree | 16 | 0 |
| Bachelor’s Degree | 15 | 2 |
| Post-Baccalaureate | 0 | 0 |
| Master’s Degree | 21 | 1 |
| Post-Master’s | 7 | 0 |
| Doctor’s Degree (Research) | 12 | 1 |
| Doctor’s Degree (Professional Practice) | 1 | 0 |
| Doctor’s Degree (Other) | 0 | 0 |
Explore Major by State
Alabama
California
District of Columbia
Idaho
Kansas
Maryland
Mississippi
Nevada
New York
Oklahoma
South Carolina
Utah
West Virginia
Alaska
Colorado
Florida
Illinois
Kentucky
Massachusetts
Missouri
New Hampshire
North Carolina
Oregon
South Dakota
Vermont
Wisconsin
Majors Related to Other Rehabilitation and Therapeutic Professions
You may also be interested in one of the following majors related to other rehabilitation and therapeutic professions.
References
*The racial-ethnic minorities count is calculated by taking the total number of students and subtracting white students, international students, and students whose race/ethnicity was unknown. This number is then divided by the total number of students at the school to obtain the racial-ethnic minorities percentage.
- College Factual
- College Scorecard
- National Center for Education Statistics
- O*NET Online
- U.S. Bureau of Labor Statistics
- Usual Weekly Earnings of Wage and Salary Workers First Quarter 2020
- Image Credit: By Barbara E. Carver under License
More about our data sources and methodologies.
HealthcareDegreeSearch.com provides higher-education, college and university, degree, program, career, salary, and other helpful information to students, faculty, institutions, and other internet audiences. Presented information and data are subject to change. Inclusion on this website does not imply or represent a direct relationship with the company, school, or brand. Information, though believed correct at time of publication, may not be correct, and no warranty is provided. Contact the schools to verify any information before relying on it. Financial aid may be available for those who qualify. The displayed options may include sponsored or recommended results, not necessarily based on your preferences.
© HealthcareDegreeSearch.com – All Rights Reserved.