Engineers, All Other in South Carolina
Considering working as an Engineers, All Other in South Carolina? Here’s what you need to know. All engineers not listed separately. Excludes “Sales Engineers” (41-9031), “Locomotive Engineers” (53-4011), and “Ship Engineers” (53-5031).
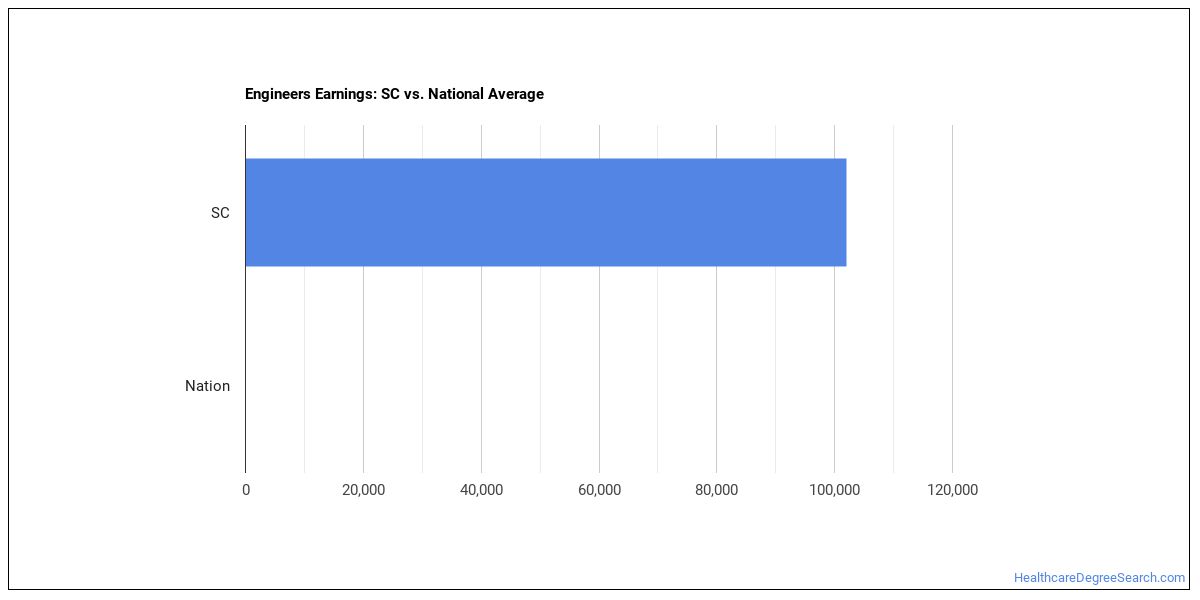
What do Engineers, All Other Make in South Carolina?
For a engineers, all other working in South Carolina, the typical annual salary is $117,980 per year (or roughly $56.72/hour).Annual wages span from $77,380 at the 10th percentile to $175,430 at the 90th percentile.
| Wage Statistic | Annual | Hourly |
|---|---|---|
| 10th percentile | $77,380 | $37.20 |
| 25th percentile | $94,240 | $45.31 |
| Median (50th) | $117,980 | $56.72 |
| 75th percentile | $144,520 | $69.48 |
| 90th percentile | $175,430 | $84.34 |

The location quotient — a measure of how concentrated this occupation is in South Carolina compared to the national average — is 0.64, suggesting fewer engineers, all other per worker than the national average.
National Wage Comparison
Nationally, engineers, all other earn a median of $136,628 per year ($65.69/hour), lower than the South Carolina median.
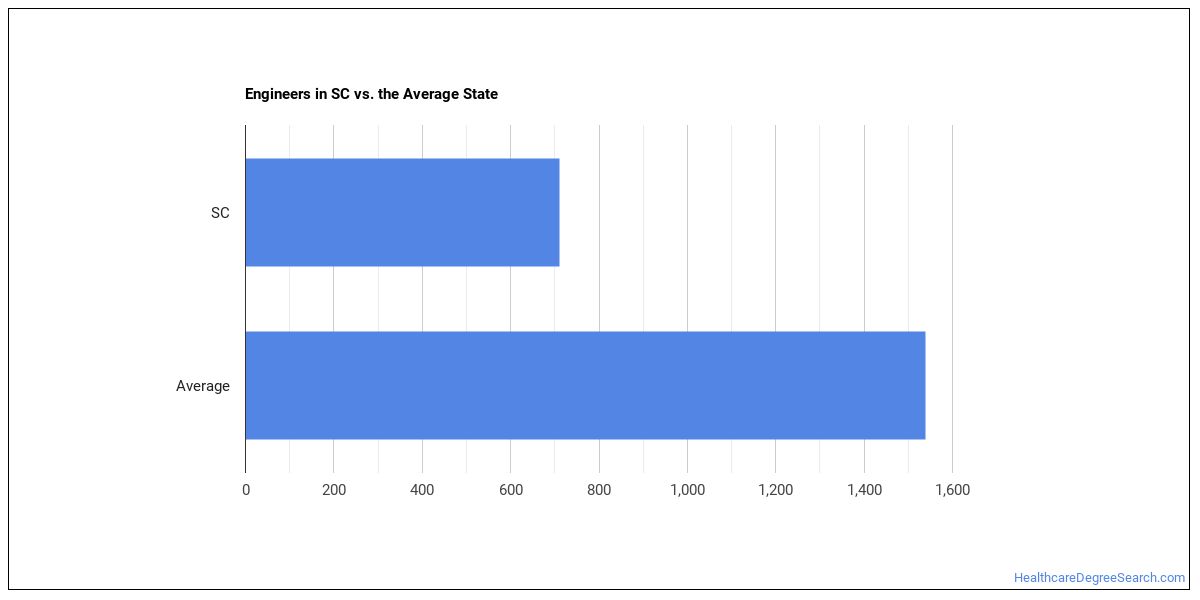
Employment Outlook
There are roughly 306,046 engineers, all other across the United States. In South Carolina alone, around 1,430 people work in this role. That matches the typical state median of 1,430.

Top South Carolina Metros for Engineers, All Other
The largest metro-area employers of engineers, all other in South Carolina.
| Metro Area | Number Employed | Annual Median Salary |
|---|---|---|
| Charleston-North Charleston, SC | 490 | $126,170 |
| Greenville-Anderson-Greer, SC | 360 | $109,480 |
| Columbia, SC | 140 | $124,380 |
| Spartanburg, SC | 90 | $102,070 |
Top States for Engineers, All Other Employment
These states have the highest employment of engineers, all other work.
| State | Number Employed |
|---|---|
| California | 26,500 |
| Texas | 9,900 |
| Florida | 9,120 |
| Louisiana | 7,630 |
| Maryland | 6,670 |
| Michigan | 6,630 |
| Virginia | 5,980 |
| Ohio | 5,970 |
| New York | 5,020 |
| Pennsylvania | 4,710 |
| Tennessee | 4,610 |
| North Carolina | 4,230 |
| Georgia | 3,970 |
| New Jersey | 3,910 |
| Alabama | 3,370 |
| Washington | 3,150 |
| Illinois | 3,010 |
| Massachusetts | 2,930 |
| Arizona | 2,660 |
| District of Columbia | 2,640 |
Highest-Paying States for Engineers, All Other
Where engineers, all other earn the most: engineers, all other.
| State | Annual Median Salary |
|---|---|
| District of Columbia | $167,270 |
| Alabama | $146,480 |
| New Mexico | $142,520 |
| Virginia | $142,110 |
| Wyoming | $139,010 |
| Maryland | $135,990 |
| Alaska | $132,410 |
| Massachusetts | $132,020 |
| New Jersey | $131,960 |
| Rhode Island | $131,830 |
What Major Will Prepare You For This Career?
Related college programs include:
- Rehabilitation Professions
Featured schools near , edit
Also Known As
Application Engineer, Bioengineer, Biomedical Engineer, Coastal Engineer, Commercial Engineer, Consulting Engineer, Corrosion Control Engineer, Design Engineer, Director Engineering, Distribution Engineer, Engineer, Engineering Analyst, Engineering Consultant, Full Stack Engineer, Hydrodynamicist.
References
- U.S. Bureau of Labor Statistics, Occupational Employment and Wage Statistics — https://www.bls.gov/oes/
- O*NET Online — https://www.onetonline.org/
- BLS Employment Projections — https://www.bls.gov/emp/
- O*NET-SOC code: 17-2199.00
HealthcareDegreeSearch.com provides higher-education, college and university, degree, program, career, salary, and other helpful information to students, faculty, institutions, and other internet audiences. Presented information and data are subject to change. Inclusion on this website does not imply or represent a direct relationship with the company, school, or brand. Information, though believed correct at time of publication, may not be correct, and no warranty is provided. Contact the schools to verify any information before relying on it. Financial aid may be available for those who qualify. The displayed options may include sponsored or recommended results, not necessarily based on your preferences.
© HealthcareDegreeSearch.com – All Rights Reserved.