Health Diagnosing and Treating Practitioners in Arkansas
Want to work in Arkansas as a Health Diagnosing and Treating Practitioner? Read this first!
- Projected employment for Health Diagnosing and Treating Practitioners in Arkansas is growing faster than average.
What Major Will Prepare You For a Health Diagnosing and Treating Practitioner Career?
- Health Professions
- Alternative Medicine & Systems
- General Alternative and Complementary Medicine and Medical Systems
- Acupuncture and Oriental Medicine
- Naturopathic Medicine/Naturopathy
- Homeopathic Medicine/Homeopathy
- Ayurvedic Medicine/Ayurveda
- Holistic/Integrative Health
- Other Alternative and Complementary Medicine and Medical Systems
- Alternative Medical Support Services
- Direct Entry Midwifery
- Energy & Biologically Based Therapies
- Aromatherapy
- Polarity Therapy
- Reiki
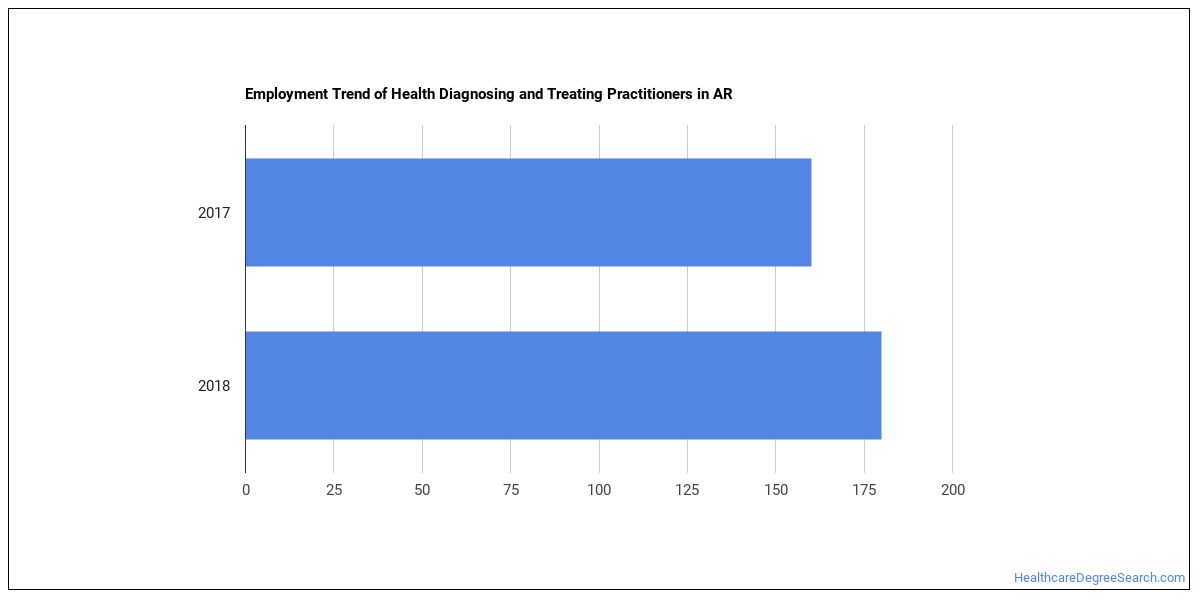
How Many Health Diagnosing and Treating Practitioners Work in Arkansas?
In Arkansas, there were 180 people working as Health Diagnosing and Treating Practitioners in the year 2018.
There were 160 Health Diagnosing and Treating Practitioners employed in this state in 2017.
That’s growth of 20 jobs between 2017 and 2018.
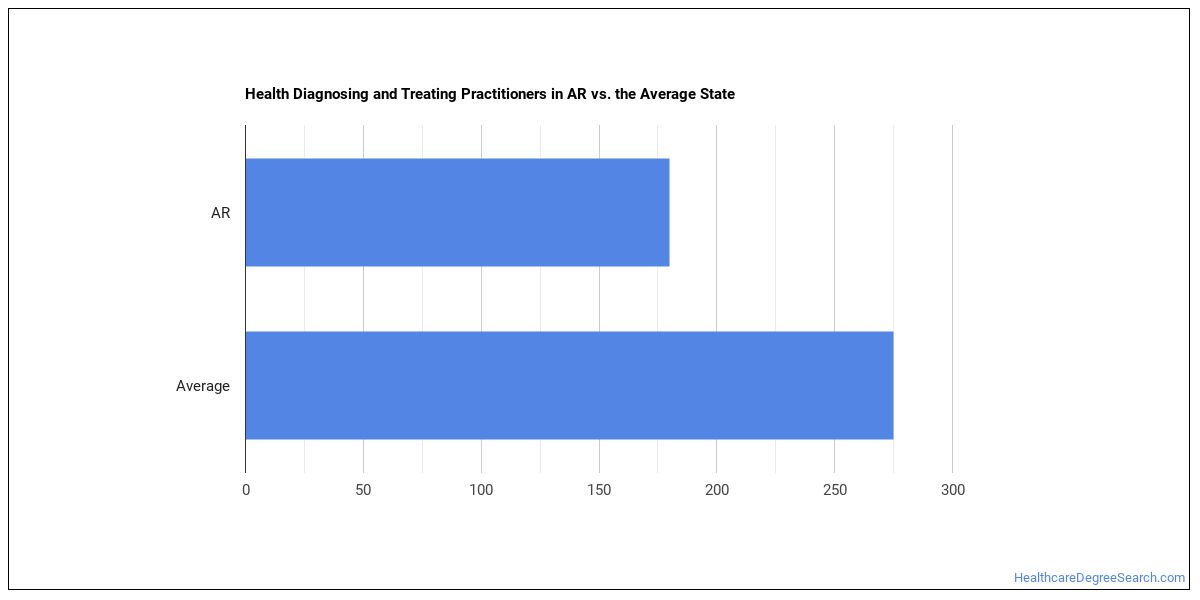
The typical state has 275 Health Diagnosing and Treating Practitioners working in it, which means Arkansas has fewer Health Diagnosing and Treating Practitioners than average.
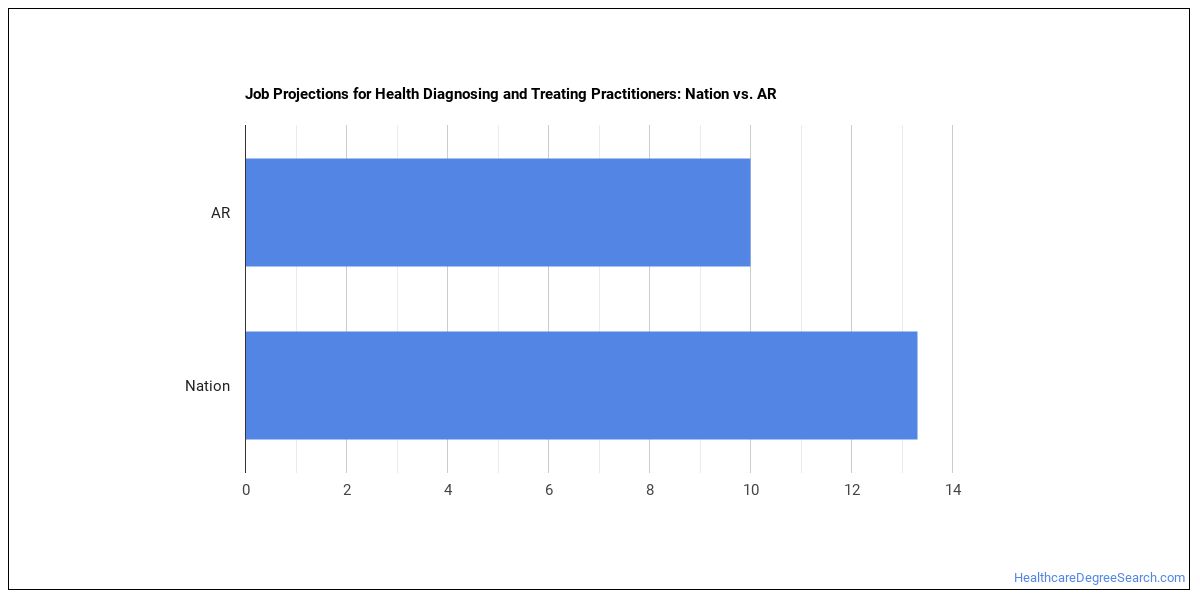
Job Projections for Arkansas
Jobs for Health Diagnosing and Treating Practitioners in this state are growing at a rate of 10.0% which is slower than the nationwide estimated projection of 13.3%.
Arkansas Annual Job Openings
The BLS is projecting 10 annual Health Diagnosing and Treating Practitioners job openings in Arkansas, and 220 total jobs in the year 2026.
Nationwide, the prediction is 3,800 annual jobs and 63,900 total jobs in 2026.
What do Health Diagnosing and Treating Practitioners Make in Arkansas?
In 2017 the median pay for this field was $34.66 an hour.
Explore Best Ranked Schools for You
Top Arkansas Metros for Health Diagnosing and Treating Practitioners
The table below shows some of the metros in this state with the most Health Diagnosing and Treating Practitioners.
| Metro | Number Employed | Annual Median Salary |
|---|---|---|
| Little Rock-North Little Rock-Conway, AR | 140 | n/a |
| Memphis, TN-MS-AR | 80 | $56,500 |
Top States for Health Diagnosing and Treating Practitioners Employment
View the list below to see where most Health Diagnosing and Treating Practitioners work.
| State | Number Employed | Annual Median Salary |
|---|---|---|
| Maryland | 5,450 | $136,660 |
| California | 4,130 | $68,750 |
| New York | 2,700 | $63,760 |
| Georgia | 2,560 | $103,840 |
| Illinois | 2,230 | $64,100 |
| Florida | 1,950 | $64,790 |
| Indiana | 1,670 | $59,000 |
| New Jersey | 1,210 | $82,260 |
| Washington | 1,080 | $66,390 |
| Texas | 980 | $66,270 |
| Colorado | 860 | $56,560 |
| North Carolina | 830 | $91,210 |
| Massachusetts | 820 | $74,160 |
| Minnesota | 820 | $88,030 |
| Ohio | 790 | $80,560 |
| Oregon | 660 | $75,510 |
| Pennsylvania | 560 | $70,720 |
| Arizona | 540 | $63,970 |
| Michigan | 490 | $69,370 |
| Wisconsin | 490 | $68,510 |
Below are the states where Health Diagnosing and Treating Practitioners get paid the most:
| State | Annual Median Salary |
|---|---|
| Maryland | $136,660 |
| District of Columbia | $126,060 |
| Georgia | $103,840 |
| North Carolina | $91,210 |
| Delaware | $89,150 |
| Minnesota | $88,030 |
| New Jersey | $82,260 |
| Virginia | $80,720 |
| Ohio | $80,560 |
| Connecticut | $77,120 |
References
- Bureau of Labor Statistics (BLS)
- College Factual
- National Center for Education Statistics
- O*NET Online
- Image Credit: By Aphiwat chuangchoem under License
More about our data sources and methodologies.
HealthcareDegreeSearch.com provides higher-education, college and university, degree, program, career, salary, and other helpful information to students, faculty, institutions, and other internet audiences. Presented information and data are subject to change. Inclusion on this website does not imply or represent a direct relationship with the company, school, or brand. Information, though believed correct at time of publication, may not be correct, and no warranty is provided. Contact the schools to verify any information before relying on it. Financial aid may be available for those who qualify. The displayed options may include sponsored or recommended results, not necessarily based on your preferences.
© HealthcareDegreeSearch.com – All Rights Reserved.