Health/Medical Admin Services at Champlain College
If you plan to study Health/Medical Admin Services, take a look at what Champlain College. The following information will help you decide if it is a good fit for you.
Champlain College sits in Burlington, VT.
In the most recent year for which we have data, 38 health/medical admin services degrees were awarded at Champlain College.
Featured schools near , edit
Online & Distance Learning at Champlain College
Online coursework is an option at Champlain College. Among 3,259 students, 1,570 (48%) were enrolled entirely in distance education and 259 (8%) took at least some classes online.
Health/Medical Admin Services Rankings at Champlain College
Use these rankings to compare Champlain College’s Health/Medical Admin Services program against peer institutions.
Bachelor’s-Level Rankings
| Ranking | Scope | Rank |
|---|---|---|
| Best Schools (Quality) | Vermont | #2 of 3 |
| Best Value | Vermont | #3 of 3 |
| Best Schools (Quality) | New England (Region) | #27 of 49 |
| Best Value | New England (Region) | #41 of 47 |
| Best Schools (Quality) | Nationwide | #244 of 915 |
| Best Value | Nationwide | #887 of 928 |
Master’s-Level Rankings
| Ranking | Scope | Rank |
|---|---|---|
| Best Schools (Quality) | Vermont | #2 of 3 |
| Best Value | Vermont | #3 of 3 |
| Best Schools (Quality) | New England (Region) | #27 of 49 |
| Best Value | New England (Region) | #41 of 47 |
| Best Schools (Quality) | Nationwide | #244 of 915 |
| Best Value | Nationwide | #887 of 928 |
Earnings for Health/Medical Admin Services Graduates from Champlain College
Students who complete Champlain College’s Health/Medical Admin Services program earn the following amounts (per the U.S. Department of Education’s College Scorecard):
| Years After Graduation | Median Earnings |
|---|---|
| 1 year | $61,991 |
Median Debt at Graduation
Typical debt at graduation for Health/Medical Admin Services graduates from Champlain College comes in at $34,932.
Student Demographics & Diversity
Below you’ll find the composition of Health/Medical Admin Services graduates at Champlain College, broken down by degree level.
Looking at the program as a whole, Health/Medical Admin Services graduates at Champlain College are 76% women (29) and 24% men (9).
Health/Medical Admin Services Bachelor’s Program at Champlain College
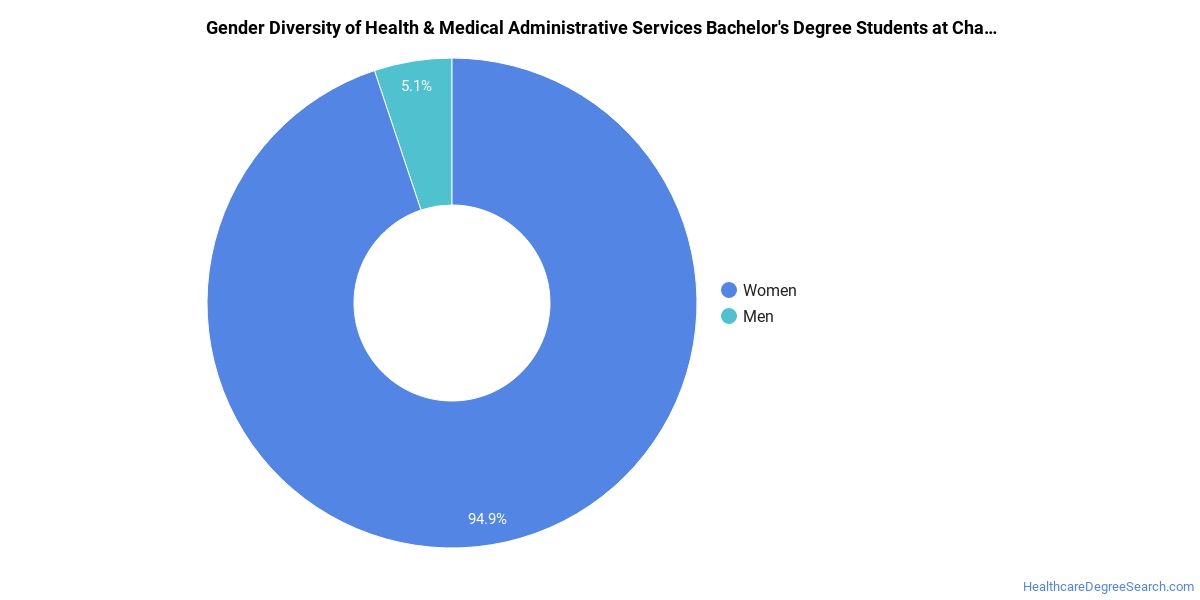
Among the 15 bachelor’s health/medical admin services graduates at Champlain College, 93% were women (14) and 7% were men (1).
The following table and chart show the race/ethnicity of Health/Medical Admin Services bachelor’s degree recipients at Champlain College.
| Race / Ethnicity | Number of Graduates |
|---|---|
| White | 10 |
| Hispanic / Latino | 1 |
| Black / African American | 2 |
| Asian | 1 |
| Unknown | 1 |
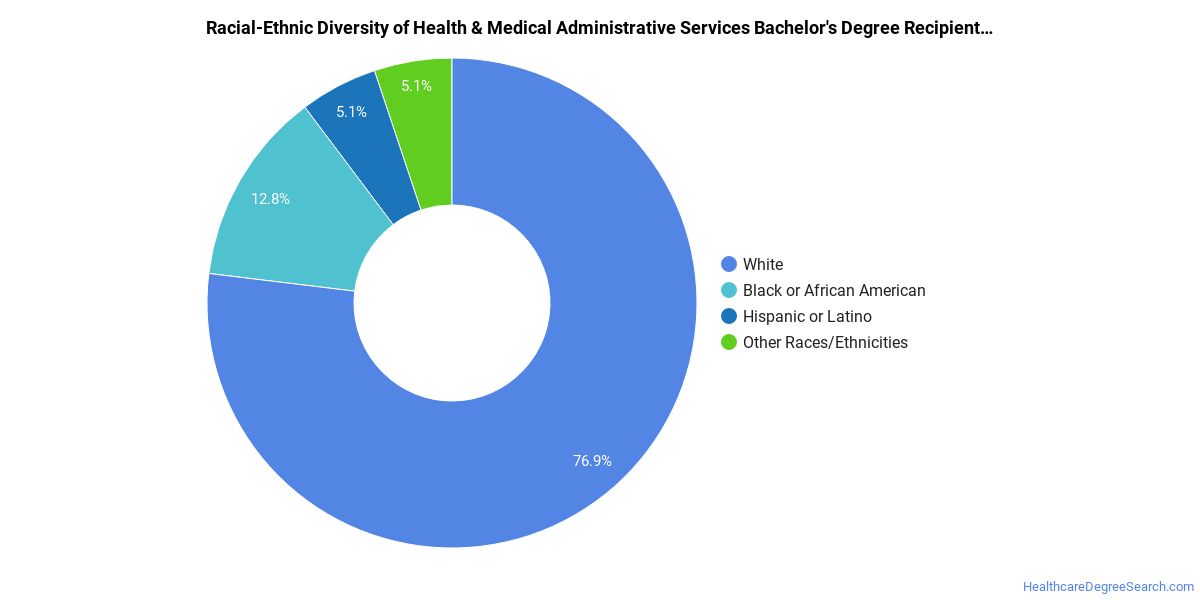
Minority students account for 27% of Health/Medical Admin Services bachelor’s degree recipients at Champlain College, below the national average of 51%.*
Health/Medical Admin Services Master’s Program at Champlain College
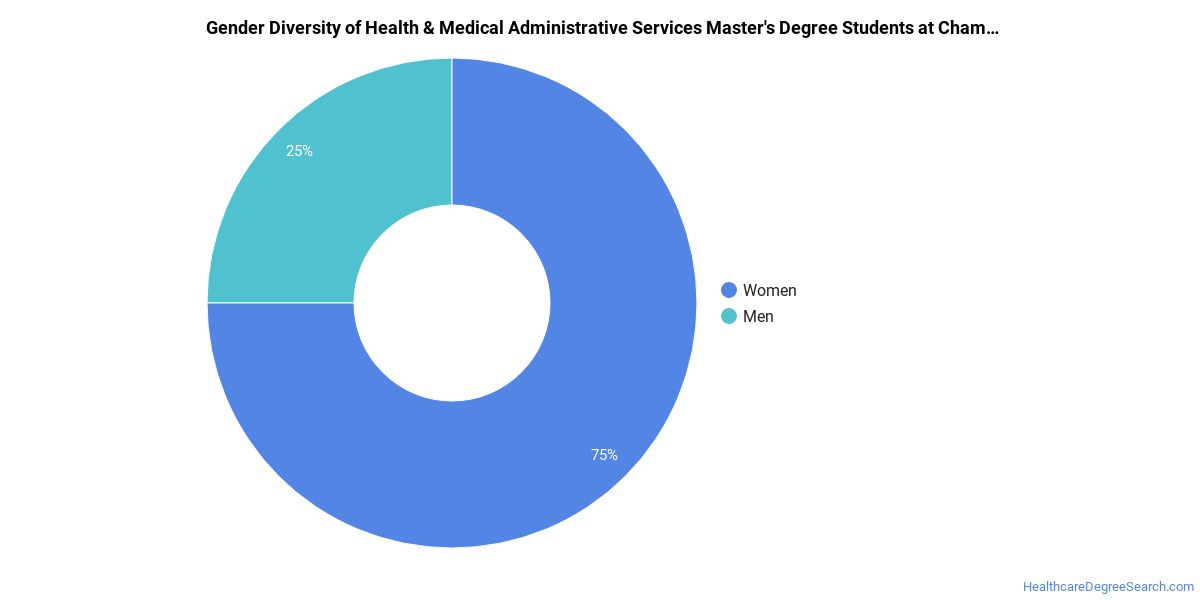
Of the 18 master’s health/medical admin services degrees awarded at Champlain College, 72% were women (13) and 28% were men (5).
The following table and chart show the race/ethnicity of Health/Medical Admin Services master’s degree recipients at Champlain College.
| Race / Ethnicity | Number of Graduates |
|---|---|
| White | 11 |
| Hispanic / Latino | 1 |
| Black / African American | 2 |
| Asian | 2 |
| Two or More Races | 1 |
| Unknown | 1 |
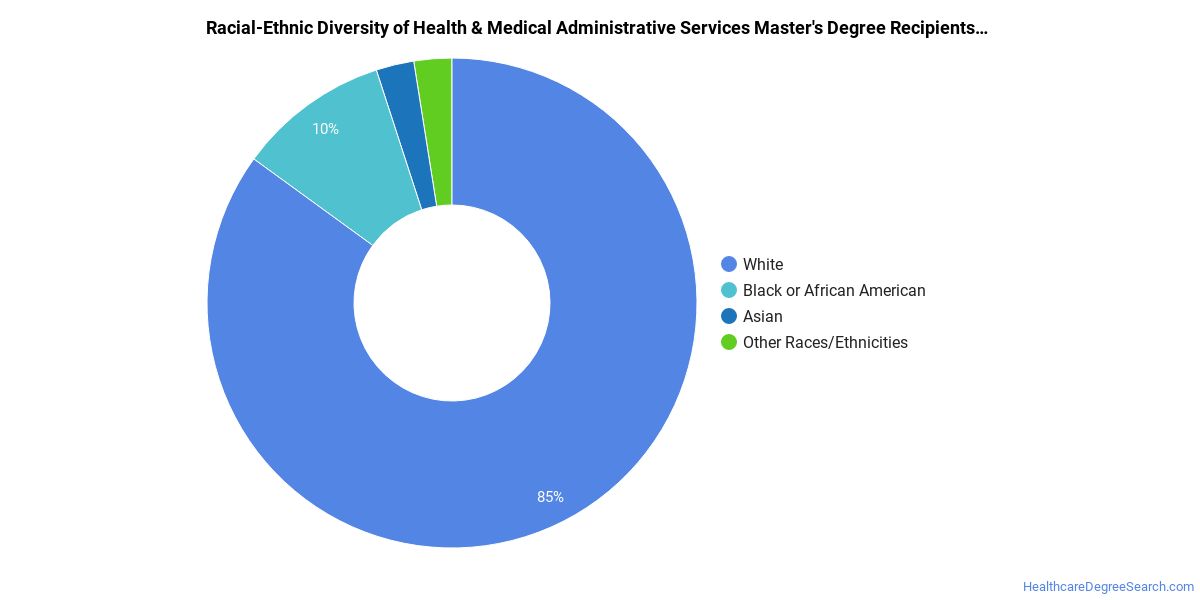
Racial-ethnic minorities make up 33% of Health/Medical Admin Services master’s degree recipients at Champlain College, lower than the national average of 45%.*
*The racial-ethnic minorities figure is the total number of graduates minus White, international (nonresident), and unknown-race graduates.
More Specific Health/Medical Admin Services Concentrations at Champlain College
This Health/Medical Admin Services program at Champlain College breaks down into more specific concentrations:
| Concentration | Graduates |
|---|---|
| Health Care Management | 23 |
| Hospital & Care Facility Management | 15 |
Highest-Paying Careers for Health/Medical Admin Services Graduates
Graduates of the Health/Medical Admin Services program at Champlain College go on to a range of careers. Here are the highest-paying careers for Health/Medical Admin Services majors, ordered by median annual salary:
| Occupation | Nationwide Median Wage |
|---|---|
| Loss Prevention Managers | $165,723 |
| Medical Records Specialists | $153,246 |
| Medical and Health Services Managers | $129,557 |
| Healthcare Practitioners and Technical Workers, All Other | $117,846 |
| Compliance Managers | $117,178 |
| Midwives | $109,643 |
| Health Information Technologists and Medical Registrars | $103,058 |
| Managers, All Other | $95,684 |
| Medical Secretaries and Administrative Assistants | $61,212 |
| Healthcare Support Workers, All Other | $53,362 |
References
- IPEDS — Integrated Postsecondary Education Data System
- U.S. Department of Education — College Scorecard
- O*NET Online (Bureau of Labor Statistics)
- National Center for Education Statistics
More about our data sources and methodologies.
HealthcareDegreeSearch.com provides higher-education, college and university, degree, program, career, salary, and other helpful information to students, faculty, institutions, and other internet audiences. Presented information and data are subject to change. Inclusion on this website does not imply or represent a direct relationship with the company, school, or brand. Information, though believed correct at time of publication, may not be correct, and no warranty is provided. Contact the schools to verify any information before relying on it. Financial aid may be available for those who qualify. The displayed options may include sponsored or recommended results, not necessarily based on your preferences.
© HealthcareDegreeSearch.com – All Rights Reserved.